In his book Blindspots, Marty Makary MD (slated to be the next FDA commissioner) discusses why routine medical practices are often slow to change, despite mounting evidenced that those practices are not supported by best evidence. Although not discussed in his book, the evaluation and treatment of hypothyroidism presents a prime example of this problem. Before diving into the issues, lets review some basic physiology.
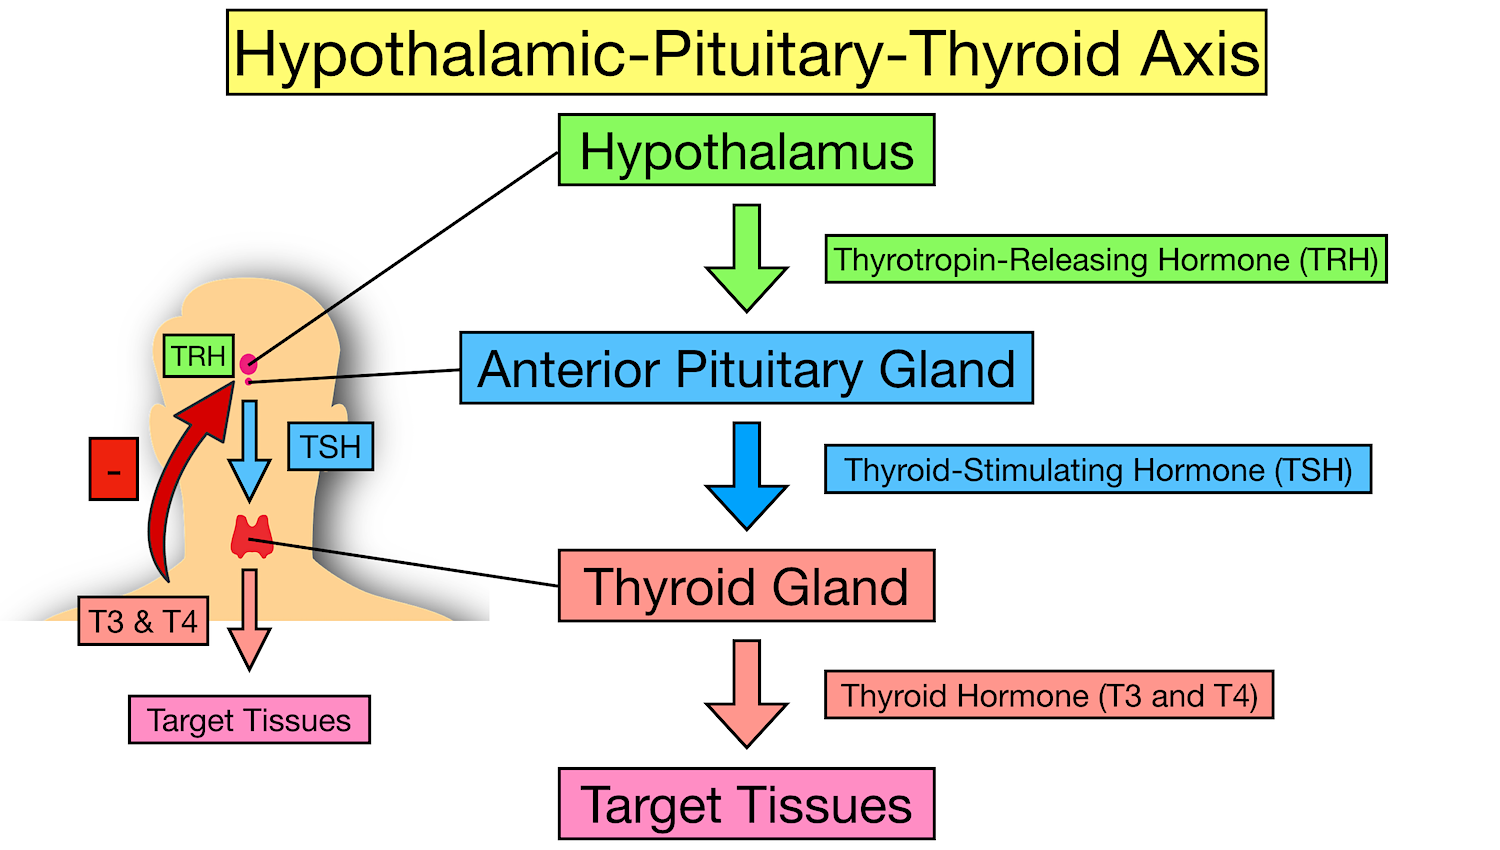
The hypothalamus in the brain produces TRH (thyrotropin releasing hormone) in response to circulating levels of T3 and T4 (two forms of thyroid hormone). TRH then stimulates production and release of TSH (thyroid stimulating hormone) in the pituitary gland. In turn, TSH stimulates the thyroid gland to produce thyroid hormone. The two forms of thyroid hormone produced by the thyroid gland are called T4 and T3 (T3 has 3 iodine molecules, T4 has 4) T4 is the predominant hormone produced by the thyroid gland. In the liver and the kidney T4 is converted to T3 through a process called deiodination, supplying 80% of circulating T3. Importantly, T3 is 7 to 10 times more potent than T4.
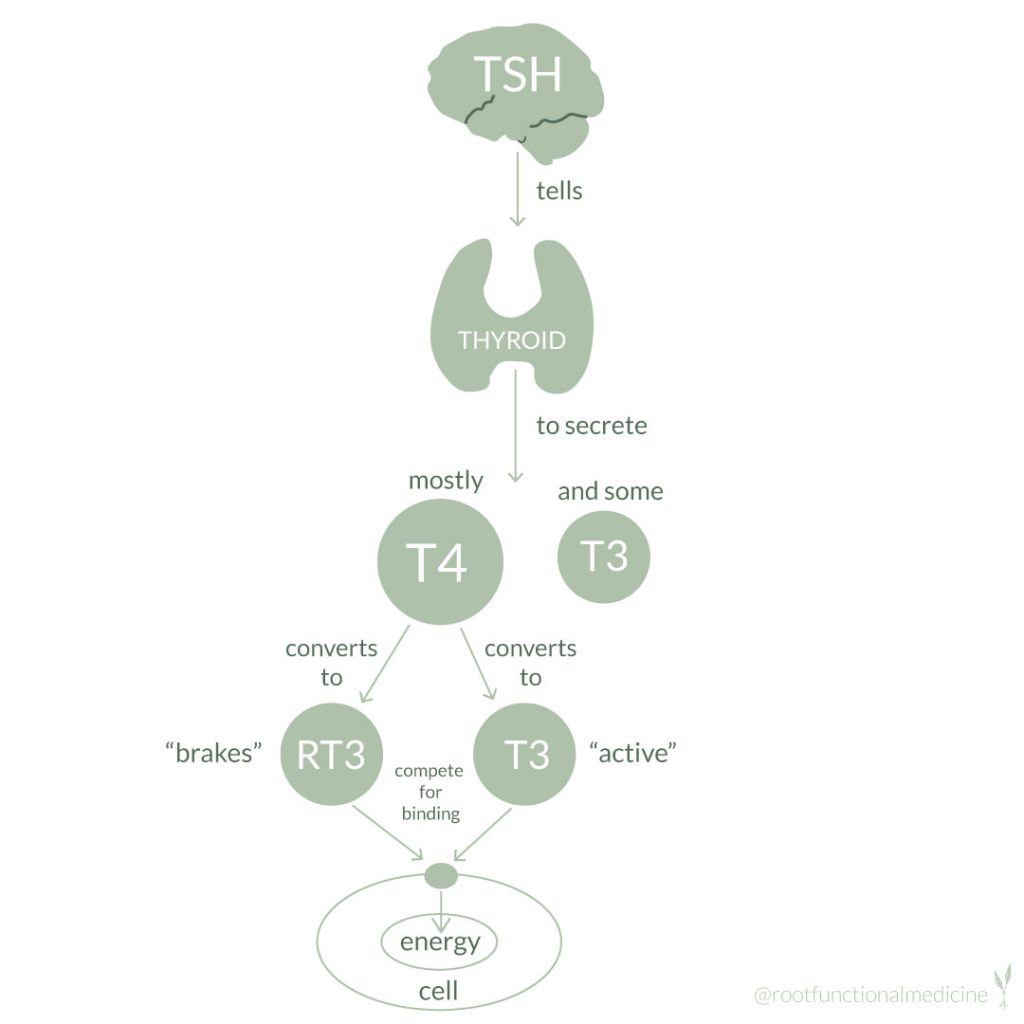
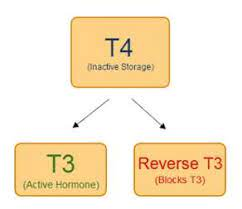
When testing thyroid function, most physicians order only TSH (thyroid stimulating hormone) and T4. But to have normal thyroid function several conditions must be met. Of those many conditions, three are often not considered by most physicians and not evaluated with TSH and T4. First, there must be adequate conversion of T4 into T3, because T3 is the form of thyroid hormone that provides most physiologic effect. Second, there must be adequate transport of T4 and T3 into your cells. Third, levels of reverse T3 should not be high enough to block adequate amounts of Thyroid Hormone binding to receptors on your cells.
The “normal” range of TSH in most labs is 0.4 to 5.0 mU/L. Recently a narrower range of 0.5-2.5 mU/L has been proposed to exclude individuals with “minimal” thyroid dysfunction, but this is controversial. This controversy is the crux of one of the many problems in interpreting “normal” thyroid function tests. Proponents of the narrower range maintain that patients with symptoms of hypothyroidism and a TSH above 2.5 might benefit from treatment. In addition, proponents of the narrower range suggest that some patients with TSH levels above 2.5 may not report symptoms of hypothyroidism but their physiology may be suboptimal for health. (https://www.ncbi.nlm.nih.gov/books/NBK278958/) Physiology of the Hypothalamic-Pituitary-Thyroid Axis.
Treatment with T4 alone, may not provide adequate thyroid replacement.
T3 and T4 enter the hypothalamus and pituitary glands “passively”, meaning an active transport mechanism is not necessary. But in the rest of the body active transport of T3 and T4 into cells is necessary. If there is a problem with the active transport system, the hypothalamus and pituitary may “see” normal levels of T3 and T4 but the rest of the body may not be getting the full benefit of thyroid hormone. Thus, TSH levels will be normal, T4 levels will be normal, but cellular T3 and T4 levels will not be adequate. Yet physicians will interpret a normal TSH and T4 to mean normal thyroid function. Conditions that impair thyroid hormone transport into cells include: insulin resistance, diabetes, obesity, chronic and acute dieting, diabetes, depression, anxiety, bipolar disorder, neurodegenerative diseases, chronic fatigue syndrome, fibromyalgia, cardiovascular disease, inflammation and chronic illness, and disorders of lipid metabolism.
Therefore, in addition to problems with deiodinase (conversion of T4 to T3), high levels of reverse t3 can render monotherapy with levothyroxine inadequate, while leaving TSH and T4 levels “normal”.
This has been a quick discussion of a complex system. Not all aspects of thyroid testing and treatment have been addressed. Hopefully this discussion will help you understand why simply measuring TSH and T4 (a common practice) will not tell you whether you have normal thyroid function. Ideally, all patients being tested would have free T3 and reverse T3 measured in addition to T4 and TSH. In addition, the free T3/reverse T3 ratio and the free T3/freeT4 ratio would be considered when deciding whether treatment with T4 alone (levothyroxine monotherapy) is adequate. Many patients would benefit from adding T3 (triiodothyronine) to T4 (levothyroxine) therapy. In addition, a TSH level above 2.5 should be carefully evaluated for hypothyroid symptoms as levels above 2.5 are arguably “abnormal” (or at least should raise a red flag as to the possibility). Finally, recognize that this discussion presents controversies in medicine. Most practitioners apply the concept of “sick euthyroid” to patients with acute illness and low T3 levels, considering it a “normal” protective mechanism that does not require thyroid hormone therapy. But under chronic conditions, many practitioners who think “outside the box” would consider poor conversion of T4 to T3 and/or high levels of reverse T3, as possible indications for thyroid hormone therapy when symptoms of hypothyroidism are present. Under these circumstances directly addressing underlying causes such as chronic inflammation may provide the best initial approach. (anti-inflammatory diet, regular exercise, good sleep habits, stress reduction, strengthen social support)
But when a patient is already on monotherapy with T4, consideration of adding T3 to improve quality of life and physiologic function is worthy of consideration when comprehensive laboratory evaluation suggests problems as described above (cellular transport, T4 to T3 conversion, high reverse T3).
For a greater dive into this subject follow these links.
THIS WEBSITE PROVIDES INFORMATION FOR EDUCATIONAL PURPOSES ONLY. CONSULT YOUR HEALTH CARE PROVIDER FOR MEDICAL ADVICE.
Eat clean, drink filtered water, love, laugh, exercise outdoors in a greenspace, get some morning sunlight, block the blue light before bed, engage in meaningful work, find a sense of purpose, spend time with those you love, AND sleep well tonight.
The benefit of omega-3 supplementation has been debated in the cardiology and nutritional literature for many years. Most studies of supplementation have failed to measure tissue levels achieved and often used very low doses. But when tissue levels were measured, either in the serum or red blood cell membrane, the studies consistently demonstrated significant reductions in all-cause mortality and cardiovascular mortality associated with high levels of omega-3 fatty acids.
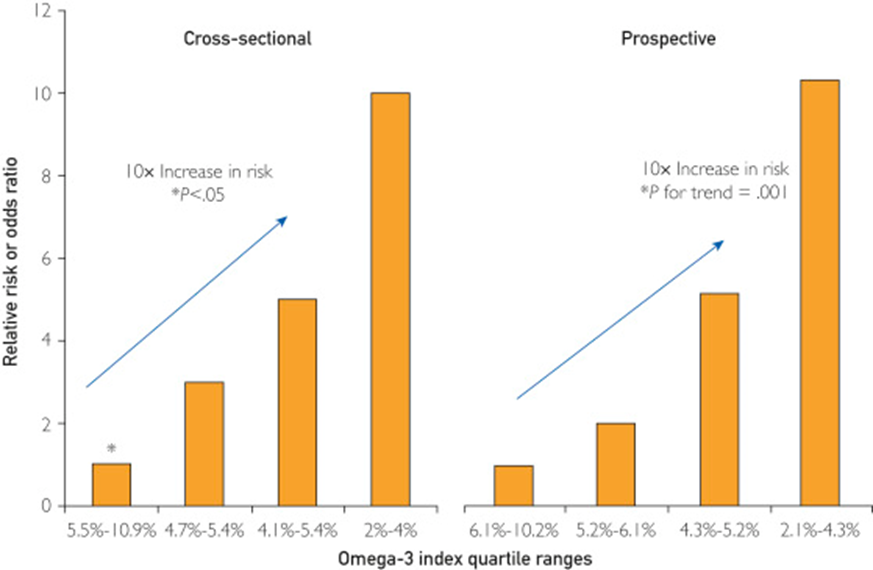
In addition, higher levels of omega 3 are associated with >=80% reduction in sudden death associated with acute myocardial infarction (acute MI) and > 80% reduction in sudden death in cohorts without known coronary artery disease followed long term.
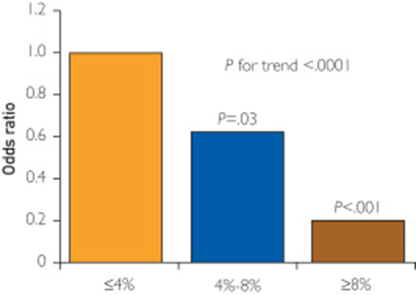
Two Coronary CT Angiogram (CCTA) studies demonstrated that patients with stable coronary artery disease on statin therapy randomized to high dose EPA and DHA had “prevention of coronary plaque progression when an omega-3 fatty acid index >= 4% was achieved.”
Another CCTA study demonstrated that patients receiving omega 3 supplementation had significantly less coronary atherosclerotic “high risk” lipid rich plaque prevalence (3.8% versus 32%) and lower total non-calcified plaque burden independent of cardiovascular risk factors compared to matched controls not receiving omega 3 supplements.
Omega 3 supplementation after an acute myocardial infarction has been found to reduce infarct size, reduce scaring (fibrosis), and enhance heart tissue healing. (Randomized controlled clinical trial) However a post MI study in 1027 elderly patients randomized to receive 1.8 grams per day of EPA+DHA versus a control group receiving corn oil showed no reduction in the primary composite cardiovascular endpoint between the two groups at 2 years but a higher incidence of AF in the omega 3 group that did not reach statistical significance.
Recently a study, widely reported by the lay press, suggested that high dose omega-3 supplementation was associated with increased risk of atrial fibrillation (AF). These results conflicted with previous studies which demonstrated just the opposite, specifically prior studies demonstrated reduced risk of AF. The more recent study suffered a significant design flaw. The study in question failed to make statistical adjustment for the increased life span associated with higher levels of omega-3. Since age is a primary risk factor for AF, any intervention which increases life span would be expected to result in more AF over the lifetime of the patients as they aged (i.e., more elder years results in increased risk of AF). Therefore, statistical adjustment for that effect should be employed, but was not done in the study.
Unfortunately, science journalism has deteriorated to a state where the conclusions of study authors are most often quoted without interpretation or context, and without critical analysis or comparisons with previous studies that may have demonstrated opposing results.
In addition to large well-designed studies that have suggested a reduced risk of AF associated with omega-3 fatty acids, there have been natural experiments that provide reassuring information. The indigenous Inuit people of Greenland, for example, historically consumed large amounts of omega-3 in their diet with no evidence of increased risk of AF. In fact, before the introduction of western processed foods, estimates of AF among the Inuit were 0.6% (1963) compared to a “worldwide prevalence of AF in adults between 2 and 4%, between one and two percent in Canadian and the general US population and between 0.5% and 3% in most low- and middle-income countries.” A more recent study of Greenland yielded a prevalence of 1.4% likely reflecting a change in habits consisting of less exercise, more tobacco use and a shift to a more Western diet.
Still, multiple studies that used high dose omega 3 supplements in patients with known cardiac disease suggest an increased risk of AF. A good review of omega-3 fatty acids and atrial fibrillation was published in the Korean Journal of Internal Medicine, referenced below.
My interpretation of the complex data in this area is as follows.
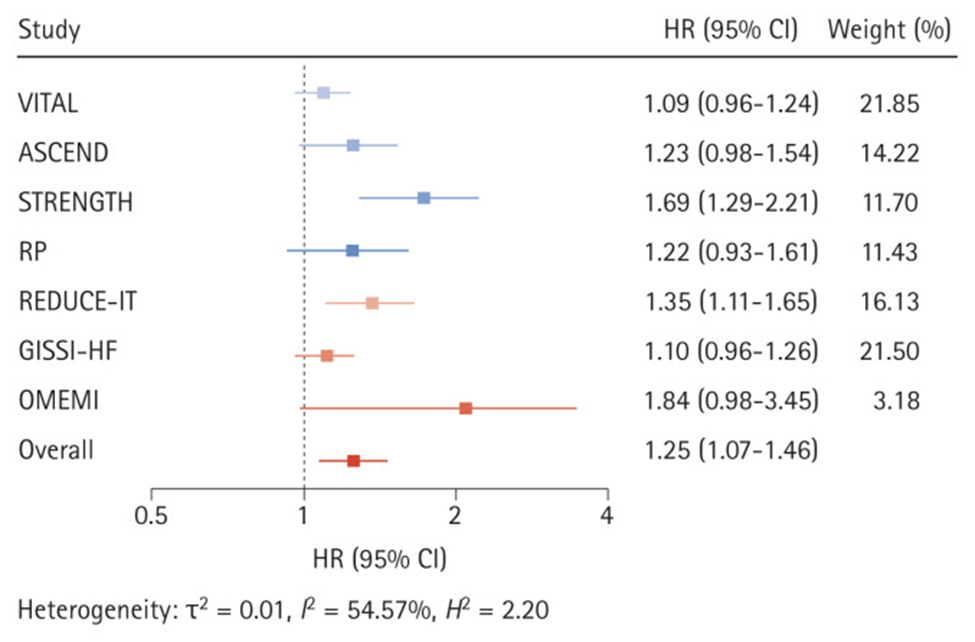
At supplemental doses of EPA+DHA above 1.8 grams per day (and perhaps above 1 gram per day) in patients with known coronary artery disease (CAD), at high risk of CAD, or following a myocardial infarction, the risk of AF is increased by about 25% (relative risk). But the risk of lethal ventricular arrythmias (sudden death) associated with myocardial infarction (heart attack) is 80% lower in patients with a red blood cell omega 3 index of >=8. In people without known CAD, an omega-3 index >=8% is associated with an 80% reduction in sudden cardiac death. CCTA studies show significantly lower unstable “vulnerable” plaque in patients on omega-3 supplements. Similarly, omega 3 supplementation in patients on statins associates with halted plaque progression determined by serial CCTA in non-diabetics.
In addition, higher tissue levels of omega 3 are associated with significantly reduced all-cause, cardiovascular, and cancer mortality.
Omega-3 fatty acids are the chemical precursors of SPMs, specialized pro-resolving lipid mediators which help resolve inflammation. We know that cardiovascular events are driven by chronic inflammation in the walls of arteries, often mediated by insulin resistance. Chronic inflammation contributes to atherosclerosis (production of plaque in the artery wall) as well as cardiovascular events that result when unstable plaque ruptures. Studies suggest that n-3 fatty acids may have antiarrhythmic properties with membrane-stabilizing effects in addition to antithrombotic and anti-inflammatory properties on the endothelial level. Basic science, observational studies and clinical trials have demonstrated that higher tissue levels of omega 3 fatty acids are associated with longer health span and lifespan. This understanding must be balanced with a probable increased risk of AF in certain clinical situations associated with high dose omega-3 supplements as described above (people with known CAD, high risk for CAD, or following and MI). Note that current AHA and ACC dietary guidelines include at least 2 servings of fatty fish per week, one serving provides approximately 1800 mg of omega-3.
Getting omega-3 fatty acids from cold water fatty fish would be ideal. Unfortunately, many individuals do not like salmon, sardines, mackerel or herring and simply will not consume enough of this fish to achieve protective tissue levels. Other species of fish and seafood provide much less amounts of omega 3. Another consideration is that individuals process omega 3 fats differently so different amounts of omega 3 will be necessary to reach the same protective levels in tissue. You can obtain a red blood cell omega-3 index using a home kit and a finger prick without a prescription (https://omegaquant.com/). The sample is mailed in to the lab and results reported directly to you. I have no financial relationship with these folks.
Bill Harris, PhD, is widely published in the area of omega-3 science. He developed the first clinically useful tissue assay which measures the % of omega 3 fat in red blood cell membranes, the “omega-3 index” which is the gold standard for omega 3 research and clinical testing. Although serum levels correlate with the red blood cell index, the later reveals dietary consequences of a 2-3 month period while serum levels reflect just a few days of most recent dietary habits. The red blood cell omega 3 index is analogous to the hemoglobin A1c which reveals average blood sugars over a 2–3-month period. Bill Harris suggests that 1800 mg per day of omega 3 fat consumption (food plus supplements) will achieve an index of >= 8% in most individuals.
Here are some references.
Harris WS, Tintle NL et.al., Fatty Acids and Outcomes Research Consortium (FORCE). Blood n-3 fatty acid levels and total and cause-specific mortality from 17 prospective studies. Nat Communications. 2021 Apr 22;12(1):2329. doi: 10.1038/s41467-021-22370-2. PMID: 33888689; PMCID: PMC8062567. https://pubmed.ncbi.nlm.nih.gov/33888689/
“Here we report the results of a de novo pooled analysis conducted with data from 17 prospective cohort studies examining the associations between blood omega-3 fatty acid levels and risk for all-cause mortality. Over a median of 16 years of follow-up, 15,720 deaths occurred among 42,466 individuals. We found that, after multivariable adjustment for relevant risk factors, risk for death from all causes was significantly lower (by 15-18%, at least p < 0.003) in the highest vs the lowest quintile for circulating long chain (20-22 carbon) omega-3 fatty acids (eicosapentaenoic, docosapentaenoic, and docosahexaenoic acids).Similar relationships were seen for death from cardiovascular disease, cancer and other causes”
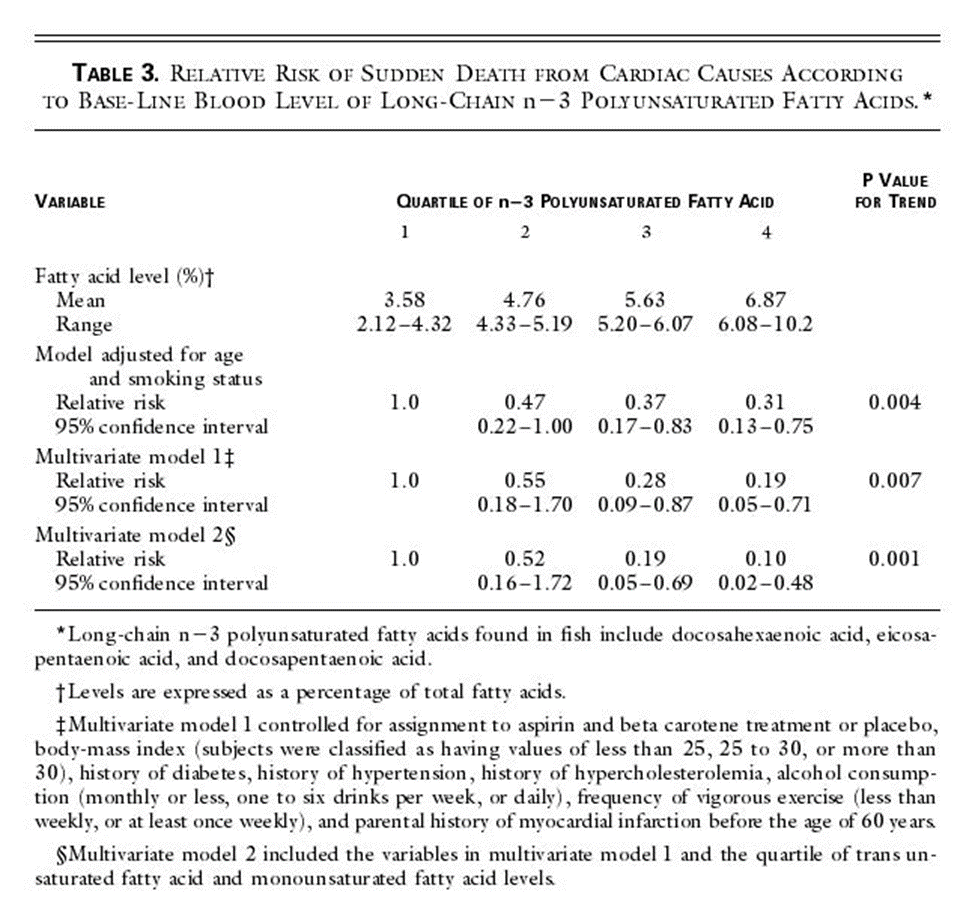
Blood Levels of Long-Chain n–3 Fatty Acids and the Risk of Sudden Death Authors: Christine M. Albert, M.D., M.P.H., Hannia Campos, Ph.D., Meir J. Stampfer, M.D., Dr.P.H., Paul M. Ridker, M.D., M.P.H., JoAnn E. Manson, M.D., Dr.P.H., Walter C. Willett, M.D., Dr.P.H., and Jing Ma, M.D., Ph.D.
We conducted a prospective, nested case–control analysis among apparently healthy men who were followed for up to 17 years in the Physicians’ Health Study. The fatty-acid composition of previously collected blood was analyzed by gas–liquid chromatography for 94 men in whom sudden death occurred as the first manifestation of cardiovascular disease and for 184 controls matched with them for age and smoking status.
RESULTS
Base-line blood levels of long-chain n–3 fatty acids were inversely related to the risk of sudden death both before adjustment for potential confounders (P for trend = 0.004) and after such adjustment (P for trend = 0.007). As compared with men whose blood levels of long-chain n–3 fatty acids were in the lowest quartile, the relative risk of sudden death was significantly lower among men with levels in the third quartile (adjusted relative risk, 0.28; 95 percent confidence interval, 0.09 to 0.87) and the fourth quartile (adjusted relative risk, 0.19; 95 percent confidence interval, 0.05 to 0.71).
CONCLUSIONS
The n–3 fatty acids found in fish are strongly associated with a reduced risk of sudden death among men without evidence of prior cardiovascular disease.
Heydari B, Abdullah S, Pottala JV, Shah R, Abbasi S, Mandry D, Francis SA, Lumish H, Ghoshhajra BB, Hoffmann U, Appelbaum E, Feng JH, Blankstein R, Steigner M, McConnell JP, Harris W, Antman EM, Jerosch-Herold M, Kwong RY. Effect of Omega-3 Acid Ethyl Esters on Left Ventricular Remodeling After Acute Myocardial Infarction: The OMEGA-REMODEL Randomized Clinical Trial. Circulation. 2016 Aug 2;134(5):378-91. doi: 10.1161/CIRCULATIONAHA.115.019949. PMID: 27482002; PMCID: PMC4973577. https://www.ahajournals.org/doi/10.1161/CIRCULATIONAHA.115.019949
Conclusions: Treatment of patients with acute myocardial infarction with high-dose omega-3 fatty acids was associated with reduction of adverse left ventricular remodeling, noninfarct myocardial fibrosis, and serum biomarkers of systemic inflammation beyond current guideline-based standard of care.
Effect of Different Antilipidemic Agents and Diets on Mortality A Systematic Review
Studer M, Briel M, Leimenstoll B, Glass TR, Bucher HC. Effect of Different Antilipidemic Agents and Diets on Mortality: A Systematic Review. Arch Intern Med. 2005;165(7):725–730. doi:10.1001/archinte.165.7.725
Compared with control groups, risk ratios for cardiac mortality indicated benefit from statins (0.78; 95% CI, 0.72-0.84), resins (0.70; 95% CI, 0.50-0.99) and n-3 fatty acids (0.68; 95% CI, 0.52-0.90).
Feuchtner G, Langer C, Barbieri F, Beyer C, Dichtl W, Friedrich G, Schgoer W, Widmann G, Plank F. The effect of omega-3 fatty acids on coronary atherosclerosis quantified by coronary computed tomography angiography. Clin Nutr. 2021 Mar;40(3):1123-1129. doi: 10.1016/j.clnu.2020.07.016. Epub 2020 Jul 22. PMID: 32778459. https://pubmed.ncbi.nlm.nih.gov/32778459/
Conclusions: Omega-3-PUFA supplementation is associated with less coronary atherosclerotic “high-risk” plaque (lipid-rich) and lower total non-calcified plaque burden independent on cardiovascular risk factors. Our study supports direct anti-atherogenic effects of Omega-3-PUFA.
Conclusions: EPA and DHA added to statins prevented coronary plaque progression in nondiabetic subjects with mean LDL-C <80 mg/dL, when an omega-3 index ≥4% was achieved. Low omega-3 index <3.43% identified nondiabetic subjects at risk of coronary plaque progression despite statin therapy
Among 3326 US men and women ≥65 years of age and free of AF or heart failure at baseline, plasma phospholipid levels of eicosapentaenoic acid, docosapentaenoic acid, and docosahexaenoic acid were measured at baseline by use of standardized methods. Incident AF (789 cases) was identified prospectively from hospital discharge records and study visit ECGs during 31 169 person-years of follow-up (1992-2006).
Conclusions: In older adults, higher circulating total long-chain n-3 PUFA and docosahexaenoic acid levels were associated with lower risk of incident AF (atrial fibrillation). These results highlight the need to evaluate whether increased dietary intake of these fatty acids could be effective for the primary prevention of AF.
An omega-3 index of less than 4% is associated with increased CHD risk, particularly for sudden cardiac death. In contrast, an omega-3 index of more than 8% is associated with low CHD risk, whereas the range between 4% and 8% is considered intermediate risk
Risk of sudden death
Alfaddagh A, Elajami TK, Ashfaque H, Saleh M, Bistrian BR, Welty FK. Effect of Eicosapentaenoic and Docosahexaenoic Acids Added to Statin Therapy on Coronary Artery Plaque in Patients with Coronary Artery Disease: A Randomized Clinical Trial. J Am Heart Assoc. 2017; 6: e006981. 10.1161/JAHA.117.006981. https://pubmed.ncbi.nlm.nih.gov/29246960/
“High-dose eicosapentaenoic acid and docosahexaenoic acid provided additional benefit to statins in preventing progression of fibrous coronary plaque in subjects adherent to therapy with well-controlled low-density lipoprotein cholesterol levels.”
Huh JH, Jo SH. Omega-3 fatty acids and atrial fibrillation. Korean J Intern Med. 2023 May;38(3):282-289. doi: 10.3904/kjim.2022.266. Epub 2022 Dec 14. PMID: 36514212; PMCID: PMC10175873 https://pubmed.ncbi.nlm.nih.gov/36514212/
.
Effects of omega-3 fatty acid supplementation on the risk of atrial fibrillation. HR, hazard ratio; CI, confidence interval; VITAL, Vitamin D and Omega-3 Trial; ASCEND, A Study of Cardiovascular Events in Diabetes; STRENGTH, Statin Residual Risk with Epanova in High Cardiovascular Risk Patients with Hypertriglyceridemia; RP, Risk and Prevention Study; REDUCE-IT, Reduction of Cardiovascular Events With Icosapent Ethyl-Intervention Trial; GISSI-HF, Gruppo Italiano per lo Studio della Sopravvivenza nell’Insufficienza Cardiaca-Heart Failure; OMEMI, Omega-3 Fatty Acids in Elderly With Myocardial Infarction. Effects of omega-3 fatty acid supplementation on the risk of atrial fibrillation. HR, hazard ratio; CI, confidence interval; VITAL, Vitamin D and Omega-3 Trial; ASCEND, A Study of Cardiovascular Events in Diabetes; STRENGTH, Statin Residual Risk with Epanova in High Cardiovascular Risk Patients with Hypertriglyceridemia; RP, Risk and Prevention Study; REDUCE-IT, Reduction of Cardiovascular Events With Icosapent Ethyl-Intervention Trial; GISSI-HF, Gruppo Italiano per lo Studio della Sopravvivenza nell’Insufficienza Cardiaca-Heart Failure; OMEMI, Omega-3 Fatty Acids in Elderly With Myocardial Infarction. Effects of omega-3 fatty acid supplementation on the risk of atrial fibrillation. HR, hazard ratio; CI, confidence interval; VITAL, Vitamin D and Omega-3 Trial; ASCEND, A Study of Cardiovascular Events in Diabetes; STRENGTH, Statin Residual Risk with Epanova in High Cardiovascular Risk Patients with Hypertriglyceridemia; RP, Risk and Prevention Study; REDUCE-IT, Reduction of Cardiovascular Events With Icosapent Ethyl-Intervention Trial; GISSI-HF, Gruppo Italiano per lo Studio della Sopravvivenza nell’Insufficienza Cardiaca-Heart Failure; OMEMI, Omega-3 Fatty Acids in Elderly With Myocardial Infarction
THIS WEBSITE PROVIDES INFORMATION FOR EDUCATIONAL PURPOSES ONLY. CONSULT YOUR HEALTH CARE PROVIDER FOR MEDICAL ADVICE.
Eat clean, drink filtered water, love, laugh, exercise outdoors in a greenspace, get some morning sunlight, block the blue light before bed, engage in meaningful work, find a sense of purpose, spend time with those you love, AND sleep well tonight.
Vax skeptics continue to claim that deaths and side-effects of the vaccine have been under-reported and the risk-benefit ratio of vaccines has been under-estimated. Many claim that the vaccine has produced more harm than good.
I do not agree.
Recently a UK cardiologist has been interviewed in the social media, claiming to have published in a “peer-reviewed journal” the dangers of vaccinations. But the media-hyped reports of his “peer-reviewed” paper have failed to report scientific debunking of his claims.
You can enjoy the debunk here.
this is worth the time.
Dr. Seheult, a quadruple boarded physician, produces on-line medical education and reviews for the lay public on many medical issues including COVID-19, vaccinations, and misinformation. He discusses excess mortality (deaths higher than expected based on historical seasonal variations) in a superb video here.
Very much worth a watch.
Summary:
During the pandemic, excess death spikes correlated with surges in Covid-19 infections not with vaccination.
Potential causes include Covid infections, decreased cancer screening and treatment, hesitancy to seek necessary medical care (emergency rooms and office visits), overburdened hospital and out-patient care because of Covid infections (limited ICU beds, hospital beds, primary care visits, etc.). With limited resources including staff, ICU beds, hospital beds, and primary care, when these resources are filled by Covid surges, patients with other needs do not get the usual care they deserve. Likewise, many patients avoid seeking medical care out of fear.
Other contributing factors likely include social isolation, depression, lack of exercise, lack of sunshine, disturbed sleep, pandemic anxiety, pandemic related stress all of which increase risk of acute and long-Covid as well as other medical problems.
In the context of the COVID 19 pandemic I will close with the usual summary.
Exercise, especially out of doors in a green space, supports the immune system
Get some sunshine and make sure you have adequate Vitamin D levels. Supplement with Vitamin D3 to get your levels above 30 ng/ml, >40ng/ml arguably better.
Eliminate sugar-added foods and beverages from your diet. These increase inflammation, cause metabolic dysfunction, and suppress immunity.
Eliminate refined-inflammatory “vegetable oils” from your diet, instead eat healthy fat.
Clean up your home environment and minimize your family’s exposure to environmental toxins by following recommendations at EWG.org with regards to household products, personal care products, and organic foods. (https://www.ewg.org/)
Drink water filtered through a high quality system that eliminates most environmental toxins.
If you are eligible for vaccination, consider protecting yourself and your neighbor with a few jabs. Age > 50 and/or risk factors (diabetes, pre-diabetes, insulin resistance, hypertension, heart disease, COPD, obesity, immune suppression, asthma) suggests benefit from a booster. Risk for complications of boosters in adolescents, especially healthy males, without risk factors, may equal benefits. Previous infection with Covid can be considered as protective as a booster. Discuss risk vs benefit with your physician.
THIS WEBSITE PROVIDES INFORMATION FOR EDUCATIONAL PURPOSES ONLY. CONSULT YOUR HEALTH CARE PROVIDER FOR MEDICAL ADVICE.
Eat clean, drink filtered water, love, laugh, exercise outdoors in a greenspace, get some morning sunlight, block the blue light before bed, engage in meaningful work, find a sense of purpose, spend time with those you love, AND sleep well tonight.
Again, another biased article claims to demonstrate the dangers of red meat. There are so many problems with the author’s analysis and conclusions it is hard to know where to begin. Rather than go through the nitty gritty here, just head on over to this analysis to read another debunking of the same litany of bad science.
Exercise, especially out of doors in a green space, supports the immune system
Get some sunshine and make sure you have adequate Vitamin D levels. Supplement with Vitamin D3 to get your levels above 30 ng/ml. (read this Open Letter)
Eliminate sugar-added foods and beverages from your diet. These increase inflammation, cause metabolic dysfunction, and suppress immunity.
Eliminate refined-inflammatory “vegetable oils” from your diet, instead eat healthy fat.
Clean up your home environment and minimize your family’s exposure to environmental toxins by following recommendations at EWG.org with regards to household products, personal care products, and organic foods. (https://www.ewg.org/)
If you are eligible for vaccination, consider protecting yourself and your neighbor with a few jabs.
THIS WEBSITE PROVIDES INFORMATION FOR EDUCATIONAL PURPOSES ONLY. CONSULT YOUR HEALTH CARE PROVIDER FOR MEDICAL ADVICE.
Eat clean, drink filtered water, love, laugh, exercise outdoors in a greenspace, get some morning sunlight, block the blue light before bed, engage in meaningful work, find a sense of purpose, spend time with those you love, AND sleep well tonight.
I just read an article by an immunocompromised physician published in JAMA (Journal of the American Medical Association). In this article, Dr. Lindsay Ryan, an ER physician who takes immunosuppressive medication to treat her auto-immune disease, describes her thoughts on folks who refuse to be vaccinated against COVID-19. She acknowledges the many possible reasons one might choose to avoid vaccination, many related to lack of scientific information and confusion by false information so widely spread on the internet. At the heart of her discussion lays a fundamental conflict, individual freedom vs responsibility to protect our neighbor. Dr. Ryan has been vaccinated but her immunosuppressant medication has significantly blunted her response to vaccination, leaving her unprotected by the vaccine. Therefore in her job as an ER physician she is constantly at risk for infection from an asymptomatic or symptomatic patient with any infectious disease including COVID-19. Beyond that, living a “normal life” will remain elusive for her as so many individuals continue to refuse vaccination based on a “freedom of choice” decision which places their own freedom over the interests of one’s neighbor. Many Americans are immuno-compromised. There are many medications that render the immune system less effective to various degrees. There are many conditions that compromise immune systems and render vaccination less effective. By definition, all patients who have received an organ transplant are immunocompromised. All such individuals are at increased risk of death or disability from COVID-19 exposure. The single most effective way to help protect these individuals is for everyone eligible to become vaccinated.
You can learn more about organ transplants by perusing organ transplant data for the USA. Your neighbor, the person you pass in the aisle of the grocery store, the person who is sitting in the restaurant at a table next to you, could be a transplant recipient or on an immunosuppressive drug for auto-immune disease.
According to the National Institutes of Health, up to 23.5 million Americans (more than seven percent of the population) suffer from an autoimmune disease—and the prevalence is rising.
Alternatively, they may be immunosuppressed because of chemotherapy for cancer.
How many people in the United States have cancer? More than 16.9 million Americans (8.1 million males and 8.8 million females) with a history of cancer were alive on January 1, 2019; this number is projected to reach more than 22.1 million by January 1, 2030 based on the growth and aging of the population alone.
If you choose to avoid vaccination as a form of personal freedom expression, is that choice a charitable or responsible choice? Does it balance personal freedom against responsibility for the health and safety of our neighbor? Are not immuno-compromised individuals entitled to “life, liberty and pursuit of happiness” and freedom from unnecessary risk exposure because of their neighbor’s personal choices?
We have laws against driving under the influence. Such laws seek a balance between personal freedom and responsibility towards one’s neighbor. As a society we have accepted restrictions on personal behavior that places others at risk and we have instituted laws to enforce such restrictions.
In the context of the COVID 19 pandemic I will close with the usual summary.
Exercise, especially out of doors in a green space, supports the immune system
Get some sunshine and make sure you have adequate Vitamin D levels. Supplement with Vitamin D3 to get your levels above 30 ng/ml. (read this Open Letter)
Eliminate sugar-added foods and beverages from your diet. These increase inflammation, cause metabolic dysfunction, and suppress immunity.
Eliminate refined-inflammatory “vegetable oils” from your diet, instead eat healthy fat.
Clean up your home environment and minimize your family’s exposure to environmental toxins by following recommendations at EWG.org with regards to household products, personal care products, and organic foods. (https://www.ewg.org/)
If you are over age 12 and eligible for vaccination, consider protecting yourself and your neighbor with vaccination.
THIS WEBSITE PROVIDES INFORMATION FOR EDUCATIONAL PURPOSES ONLY. CONSULT YOUR HEALTH CARE PROVIDER FOR MEDICAL ADVICE.
Eat clean, drink filtered water, love, laugh, exercise outdoors in a greenspace, get some morning sunlight, block the blue light before bed, engage in meaningful work, find a sense of purpose, spend time with those you love, AND sleep well tonight.
On Dec 7, 2020 a group of more than 100 scientists signed a letter recommending that governmental agencies and major medical organizations endorse their recommendation for universal Vitamin D supplementation at adequate doses in order to decrease the risk of COVID-19 infection and death.
The letter cites multiple converging sources of data from several studies that should no longer be ignored.
“To all governments, public health officials, doctors, and healthcare workers, [Residents of the USA: Text “VitaminDforAll” to 50409 to send this to your state’s governor.] Research shows low vitamin D levels almost certainly promote COVID-19 infections, hospitalizations, and deaths. Given its safety, we call for immediate widespread increased vitamin D intakes . Vitamin D modulates thousands of genes and many aspects of immune function, both innate and adaptive. The scientific evidence shows that: ● Higher vitamin D blood levels are associated with lower rates of SARS-CoV-2 infection. ● Higher D levels are associated with lower risk of a severe case (hospitalization, ICU, or death). ● Intervention studies (including RCTs) indicate that vitamin D can be a very effective treatment. ● Many papers reveal several biological mechanisms by which vitamin D influences COVID-19. ● Causal inference modelling, Hill’s criteria, the intervention studies & the biological mechanisms indicate that vitamin D’s influence on COVID-19 is very likely causal , not just correlation.“
I have previously discussed the relationship between low Vitamin D levels and COVID-19 infection.
Since that post several more studies have been published strengthening the evidence that low levels of Vitamin D are not only ASSOCIATED with increased risk of infection, severe illness and death from COVID-19, but that this relationship is CAUSATIVE.
80% of patients requiring ICU care for COVID-19 infection have low vitamin D levels (25-OH Vitamin D levels less than 30 ng/ml)
“The data strongly suggests that vitamin D is the safest, easiest, and most important anti-pandemic measure the world is failing to prioritize,” says Karl Pfleger, Ph.D., biotech investor, former Google data scientist, and one of the organizers of VitaminDforAll.org.
More than 80 percent of COVID-19 patients are deficient in Vitamin D, studies show.
But how much vitamin D should an adult take and in what form?
As discussed in the letter, 3875 IU (97 micrograms) of Vitamin D3 daily is required for 97.5% of adults to reach a level of 20 ng/ml. 6200 IU (155 mcg) are required for 97.5% of adults to reach a level of 30 ng/ml. These doses far exceed the RDA (minimum daily requirement) necessary to prevent rickets.
On a sunny day, not too far from the equator, adult humans are capable of generating 10,000 units of vitamin D per day from the interaction of sunlight with skin. Human studies have demonstrated NO TOXICITY with daily supplementation of 10,000 units Vitamin D3 per day. Because of the risks of skin cancer, common use of sun block, distance from the equator, and a decrease in the ability of humans to make vitamin D from sunlight as we age, too many people have chronically low levels.
Vitamin D is a fat soluble vitamin. On a given daily dose it takes about 3 months to reach a steady state (stable tissue levels).
The point of that open letter and similar letters which have been published in major medical journals is the following. There exists today enough data to support universal supplementation with safe doses of Vitamin D3, well above the RDA, in order to decrease the risk of COVID-19 infection, risk of severe illness, and risk of death with the infection. Any further delay, waiting for more data is senseless. The risk benefit calculation based on present data is a “no-brainer”.
My wife and I have been supplementing with 4000 IU per day. Fauci is reported to be taking 6000 IU per day. We take it with food in order to maximize absorption. Our levels have been measured. Our levels are >30 ng/ml, <40 ng/ml on this dose. These are protective levels.
The amount of supplementation necessary to achieve these levels varies from person to person, season to season, and varies with distance from the equator. Some individuals will require less, some more to achieve levels above 30 ng/ml. But adults can safely take the daily amount recommended in VitaminDforall, http://HTML version.
The suggested protocol for those not already receiving the recommended intake is 10,000 IU (250mcg) daily for 2-3 weeks (or until achieving 30ng/ml if undergoing testing), followed by taking 2000-4000 IU daily thereafter.
In the context of the COVID 19 pandemic I will close with the usual summary.
Exercise, especially out of doors in a green space, supports the immune system
Get some sunshine and make sure you have adequate Vitamin D levels. Supplement with Vitamin D3 to get your levels above 30 ng/ml. (read this Open Letter)
Eliminate sugar-added foods and beverages from your diet. These increase inflammation, cause metabolic dysfunction, and suppress immunity.
Eliminate refined-inflammatory “vegetable oils” from your diet, instead eat healthy fat.
Clean up your home environment and minimize your family’s exposure to environmental toxins by following recommendations at EWG.org with regards to household products, personal care products, and organic foods. (https://www.ewg.org/)
THIS WEBSITE PROVIDES INFORMATION FOR EDUCATIONAL PURPOSES ONLY. CONSULT YOUR HEALTH CARE PROVIDER FOR MEDICAL ADVICE.
Eat clean, drink filtered water, love, laugh, exercise outdoors in a greenspace, get some morning sunlight, block the blue light before bed, engage in meaningful work, find a sense of purpose, spend time with those you love, AND sleep well tonight.
This week began the saga of vaccine implementation for the mRNA vaccine developed by the Pfizer-BioNtech partnership. The New England Journal of Medicine published a peer-reviewed article reporting the data from the RCT (Randomized Controlled Trial) and an Editorial appeared on the same day in the NEJM. You can view both here:
Here is the most important table in the peer-reviewed article:
Age > 55 includes >=65 and >=75, Age >= 65 includes age >=75. If age>= 75 were not listed separately, all age groups would have statistical significance. This is why overall number of infections in the vaccine group is 8 but the total of the four age groups is 9. One of the 3 infections in age >55 was 65 or older. Got it?
Look at the third column labeled “Surveillance Time”. The first number in this column is described under the caption as “total time in 1000 person-years for the given endpoint..” So multiply by 1000 and you get a number that represents “person years” of observation. This is an odd number but a reasonable way to present information. The trial data covers a period of 6 months starting from when the first patient was vaccinated. The median duration of observation was 2 months after vaccination with the second dose. (50% of patients had been vaccinated for more than 2 months and 50% of patients less than 2 months)
The number in parentheses gives the number of people in each category of age, sex, race/ethnic group, country.
Notice that as we descend through the age groups from youngest to oldest, the number of participants decreases significantly in >= 65 and >=75 years old.
Now go to the last column labeled “Vaccine Efficacy, %”. The first number is the overall efficacy for that age group. But how confident are we about that efficacy % for each age group? The numbers in the parentheses represents a range or “confidence interval” which is determined statistically. This range is determined by the number of people in each (age) group and by the difference between the placebo and drug treatment outcome in that age group.
Note that the confidence interval widens as you go down from younger to older age groups. That is primarily because the number of people represented by the groups age >=65 and >= 75 are much smaller than the first two age groups.
For the age group > 65, the efficacy is reported at 94.7%. But that is an average number that shows that compared to the placebo group, the symptomatic infection rate in the vaccinated group was 94.7% lower. For the age group between >=65, there were 19 cases of symptomatic infection in the placebo group and only 1 in the vaccine group. 1/19 equals 0.0526. 1 minus 0.0526 equals 0.947 or 94.7% (rounding).
What is a 95% confidence interval?
The 95% confidence interval is the the range over which we are 95% confident the “true” value falls within. In other words, for age >=65 there is a 95% probability that the true vaccine efficacy falls somewhere between 66.7% and 99.9%. As more people age >=65 are entered into the trial, the confidence interval will get narrower for that age group provided the difference between the placebo and vaccine group remains the same. If the difference between placebo and vaccine groups increases AND the number of people in this age group increases, the confidence interval will shrink further.
This is a fantastic result!
But now look at the confidence interval for age >=75. It is -13.1-100. A minus number is in the range. That means we do not have enough people in the study age 75 or older to reach a “statistically significant” conclusion. There were only 774 folks who received the vaccine and 785 people who received the placebo in this age group. 5 in the placebo group got sick, 1 in the vaccine group got sick. This difference shows a “trend” but does not reach “statistical significance”. We need more data for this group.
But again, do not lose heart. Based on this data, which includes efficacy and safety overall, I recommend that my 92 year old mother-in-law receive the vaccine as soon as it is available.
What is “statistical significance”?
Simply stated, a result is “statistically significant” in a drug trial if the probability that the difference between the placebo group and the drug group occurred by accident (or by chance) is less than or equal to 5%. Or to put it another way, the probability that the difference between placebo and drug did not occur by chance but rather represents a true difference in outcome is 95% or greater. 5% is the standard cutoff point in medical trials. This is usually reported as a “p value”. If a p value is less than or equal to 0.05 the difference is considered statistically significant.
“Clinical significance” is another issue. For example, a drug might only decrease relative risk of an event by 5%, but the result could be “statistically significant”.
In the case of this vaccine, the clinical significance is outstanding.
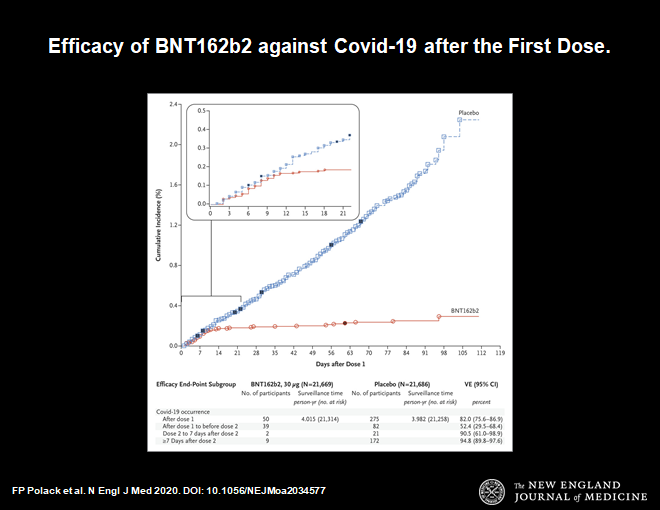
Here is another important chart.
Protection begins at day 14 after first dose
This chart demonstrates that 14 days after the first dose of vaccine protection from symptomatic infection begins. The blue line shows infections in the placebo group, the red line is the vaccine group. They diverge at day 14. Thereafter the divergence increases. This makes sense. It is consistent with our understanding of how the immune system works. This time course is very reassuring.
Now let us look at side effects.
These are the usual side effects expected with any vaccine. Symptoms such as fever, malaise, local reaction at the injection site, muscle aches are all to be expected. This profile is a little worse than the flu vaccine, but less compared to the shingles vaccine.
So far 2 episodes of anaphylaxis have occurred in the US and in UK with the vaccine rollout. (millions of doses already given) This can happen with any vaccine, that is why 15 minutes of observation following vaccination is part of the protocol and the vaccine should only be administered in a location that has epinephrine available to treat a severe allergic reaction.
This vaccine time sequence is historically unprecedented. This was made possible by a combination of advances in science and incredible action on the part of the public and private sectors in response to a global crisis. Prior to this, the shortest time to develop an effective vaccine was 4.5 years (measles mumps, and that was done by Maurice Hilleman with the help of a few lab assistants, more about Maurice in my next post).
I received my first dose of the vaccine today (as a member of hospital medical staff). I was directed to a CDC website to register as a vaccine recipient. The CDC will send me periodic questions on side effects which I will answer. If everyone participates in this program more data will become available on safety and efficacy. So please participate when you get the vaccine (vsafe.cdc.gov).
Many questions remain. Here is a quote from the NEJM editorial:
Will unexpected safety issues arise when the number grows to millions and possibly billions of people?
Will side effects emerge with longer follow-up?
Implementing a vaccine that requires two doses is challenging. What happens to the inevitable large number of recipients who miss their second dose?
How long will the vaccine remain effective?
Does the vaccine prevent asymptomatic disease and limit transmission?
And what about the groups of people who were not represented in this trial,such as children, pregnant women, and immunocompromised patients of various sorts?
The logistic challenges of manufacturing and delivering a vaccine remain daunting. This vaccine, in particular, requires storage at −70°C, a factor that may limit its deployment in some areas. Nevertheless, the remarkable level of safety and efficacy the vaccine has demonstrated thus far make this a problem that we should welcome solving. What appears to be a dramatic success for vaccination holds the promise of saving uncounted lives and giving us a pathway out of what has been a global disaster.
In the context of the COVID 19 pandemic I will close with the usual summary.
Eliminate sugar-added foods and beverages from your diet. These increase inflammation, cause metabolic dysfunction, and suppress immunity.
Eliminate refined-inflammatory “vegetable oils” from your diet, instead eat healthy fat.
Clean up your home environment and minimize your family’s exposure to environmental toxins by following recommendations at EWG.org with regards to household products, personal care products, and organic foods. (https://www.ewg.org/)
THIS WEBSITE PROVIDES INFORMATION FOR EDUCATIONAL PURPOSES ONLY. CONSULT YOUR HEALTH CARE PROVIDER FOR MEDICAL ADVICE.
Eat clean, drink filtered water, love, laugh, exercise outdoors in a greenspace, get some morning sunlight, block the blue light before bed, engage in meaningful work, find a sense of purpose, spend time with those you love, AND sleep well tonight.
My last post discussed a study from Stanford that suggested 50-85 times greater Infection Rate (IR) compared to the Case Rate (CR) in Santa Clara County. The Wall Street Journal published a discussion of this Study (which has not yet been peer reviewed) claiming that it was good evidence of a much lower fatality rate for COVID-19. Turns out that study was deeply flawed. The test used likely had a false positive rate of 13%, not 0.5% assumed by the authors. That alone makes the conclusions completely bogus. In addition, the study population was not truly a random sample and likely had significant selection bias. For a complete expose watch this:
One would expect something better from Stanford, but like I said, this was not yet peer reviewed.
But the Wall Street Journal reported on it in a favorable way, not revealing that one of the authors of the study was also the author who wrote the WSJ article!
A brief note about false positives and false negatives.
Suppose you are looking at a population of 1,000,000 people with an infection rate of 1% (990,000 do not have the disease)
Assume a sensitivity of 93% (the test is positive in 93% of true positives)
Assume a specificity of 96% (false positive rate of 4%)
If you test everyone, 9300 of the 10,000 true cases will be detected, 700 of the cases will not be detected.
BUT 40,000 false positives will be found for a total of 49,300 positives. You will publish an infection rate of 4.93% while the real infection rate is only 1%.
Statistics are tricky. The sensitivity and specificity of a test are extremely important.
Be careful about what you read. We all would like to be reassured that it would be safe to relax restrictions but we still do not yet know the true IFR. The true infection rate depends on widespread testing with an accurate test and we have not yet done that.
Besides the economic downturn associated with shelter in place, there are valid clinical concerns about the damage being caused (depression, anxiety, suicide, spousal abuse, child abuse, reluctance to call 911 for a real emergency, etc..) We will need to return to less restrictions in an incremental way based on regional circumstances (NYC not the same as Northern California).
For a detailed discussion about how and when we should relax restrictions read this.
There has been allot of comparing apples with oranges in the social media. People keep trying to compare COVID-19 to the flu. They are very different with respect to the fatality rate and ease of transmission. (In addition, whereas we have had a vaccine for Influenza A and B, we do not have one for COVID-19 or any other Corona Virus)
Review:
Case Rate (CR) is the # of known cases based on nasal swab PCR test divided by population.
Infection Rate (IR) is the actual # of cases divided by population. This is estimated by performing a reliable serology test on a large random sample of people, testing for infection by measuring antibodies (there are a few tests available but their sensitivity and specificity remain controversial and crucial)
A recent analysis comparing the 2009 H1N1 influenza A pandemic to COVID 19 suggested this:
Case Fatality Rate
Infection Fatality Rate
2009 H1N1 Virus (flu)
0.1% to 0.2%
0.02%
COVID-19 New York
8%
0.50%
Some folks on social media have been comparing the CFR of the flu to the IFR of COVID-19. That is comparing apples to oranges.
The data in the table above are based on what appears to be the most recent and reliable information from New York City. The data on 2009 H1N1 is reported here.
In the old news clip below, 2920 adult deaths associated with 12 million cases of H1N1 calculates out to a 0.02% IFR which is exactly the same IFR described in the study linked above..
In this same report and in other discussions of H1N1 it was clear that children were more severely effected compared to COVID-19.
The table above would indicate that the IFR (infection fatality rate) of COVID-19 IS 25 TIMES GREATER than the IFR of the 2009 H1N1 Influenza A pandemic. The CFR of COVID-19 IN NEW YORK CITY is 40 times greater. This represents a much greater difference than the relative fatality rates suggested by the highly questionable conclusions of the Stanford Study of Santa Clara County.
There is a possibility that the New York City strain of COVID-19 might be more lethal than the strain of COVID-19 on the West Coast. That suggestion is PURELY SPECULATIVE and so far there is no data to support it. This possibility has been suggested because NYC and New Jersey hospitals are much closer to capacity with COVID-19 compared to the West Coast experience and there are portable refrigerator truck morgues outside of hospitals in NYC and New Jersey where the local morgues filled up weeks ago. Again I would point to the major differences of the apparent CFRs between various countries and regions within countries which have not yet been explained (as discussed in my last post).
We have much more to learn, we need more testing (both nasal PCR and blood serology) to understand the spread and lethality of this disease. Those in the social media who claim we already have herd immunity are spewing nonsense. Herd immunity requires > 80% infection rate. Our measured IRs are highest in NYC (about 15%) and much lower in other areas where “reliable” serology has been performed.
One great failure in our country has been the prolonged lack of adequate testing. Shelter-in-place should have been a time-out to collect data and access where we are. That can only happen with reliable wide-spread testing. To AVOID overwhelming our hospitals and health care workers we must identify cases, trace contacts, isolate positives and isolate contacts. Isolation would ideally not be at home where the disease could easily spread to the entire household. Isolation at home is only reasonable when that home has a separate bedroom and bathroom for the infected person AND the household follows strict isolation and hygiene.
We must all recognize that the primary objective of shelter in place is to avoid overwhelming the health care system. Eventually, unless a treatment or vaccine becomes available, the disease will infect most of our population before we reach herd immunity. To return to economic activity and a more “normal life” we will necessarily accept a large number of deaths, primarily but not exclusively amongst the elderly and infirm. Generally it would seem reasonable to begin incrementally relaxing restrictions in areas of low impact, wearing masks, working from home where possible, avoiding public gatherings especially in confined spaces, and following good personal hygiene. So far the best information on risk (of death) appears to be in the table above, stratifying for age and risk factors.
THIS WEBSITE PROVIDES INFORMATION FOR EDUCATIONAL PURPOSES ONLY. CONSULT YOUR HEALTH CARE PROVIDER FOR MEDICAL ADVICE.
Eat clean, drink filtered water, love, laugh, exercise outdoors in a greenspace, get some morning sunlight, block the blue light before bed, engage in meaningful work, find a sense of purpose, spend time with those you love, AND sleep well tonight.
Testing remains inadequate to determine how we should be addressing this virus. But recent data suggests that the IFR (infection fatality rate) is lower than originally thought. To understand this you must understand the difference between the CR (Case Rate) and the IR (Infection Rate) as well as the difference between the CFR (Case Fatality Rate) and the IFR (Infection Fatality Rate).
Case Rate: # Positive tests/ population
Infection Rate: # actual people infected/ population
Case Fatality Rate= #deaths/ # positive tests (# deaths/known cases)
Infection Fatality Rate= # deaths from the virus/ # infected (# deaths/ known and unknown cases)
Ideally everyone would be tested with a perfect test. A perfect test would be positive for everyone infected ( no false negatives-whether symptomatic or without symptoms) and it would be negative if the virus is not present (no false positives).
No test is perfect, but even with imperfect tests we would know much more with greater numbers of people tested, including those without symptoms.
To calculate an accurate estimate for the Infection Fatality Rate, we must widely test people without symptoms in a hard hit area such as New York City. Only then will we understand whether this virus is significantly more lethal than other viruses such as the flu. Early estimates were based on very imperfect data. Remember, Fauci stated before congress that COVID 19 is “ten times worse than the flu” based upon all the information available at the time. Fauci is arguably the most informed/knowlegable/reasonable professional we have to help guide us through this very uncertain time. The more data (testing) we obtain, the better-informed will be our plans going forward.
Shelter-in-place is most effective when started early, before the disease spreads widely and buys time to let hospitals prepare and expand capacity so that the system is not over-whelmed. Flattening the curve is important. It buys time and saves lives primarily by avoiding a situation where health care capacity is exceeded by demand (when that happens people who could have been saved do not stand a chance). But during the time-bought, we should have implemented widespread testing of people with and without symptoms to gain a better understanding of the epidemic. We did not do that. Testing remains inadequate for proper assessment of when and how we might begin to return to “the new normal”. Testing remains inadequate for understanding the risks of lifting various restrictions.
Early in an epidemic, lives are saved by testing, contact tracing, and isolation in combination with social distancing measures and the extreme measure of shelter in place. Unfortunately, we still do not know where we stand, primarily because of inadequate testing.
Below is the link to a long interview with a respected epidemiologist who explains that his recent study suggests the IFR for Covid 19 is similar to the Flu. This does not mean that shelter-in-place did not provide benefit. COVID 19 is clearly much more contagious than the Flu. But it does mean that provided we INCREASE TESTING and follow closely the impact of GRADUAL REDUCTION OF SOCIAL RESTRICTIONS, we may soon be able to allow the return of certain activities in an incremental fashion. The ideal strategy will depend on the specific local and regional circumstances (rates of infection and deaths, availability of hospital beds, ICU beds, PPE, health care workers, rural vs urban, reliance on public transportation (subways/buses vs cars), population density, degree of at-risk population, etc.)
If you choose to watch this long interview, be careful to take everything with a grain of salt. One study of IR (infection rate) in one community does not automatically translate into national policy implications. The difference between Santa Clara County CA and the New York Metropolitan area is enormous for many reasons. This should not lead to anyone dropping their cautions, throwing away masks, and resuming activity with abandon. But it should lead to understanding the completely inadequate data that we presently have to make decisions AND the great need for caution as we move forward.
The person conducting this interview clearly is biased, believing that stay-at-home was not necessary. He is constantly pressing Dr. Ioannidis to draw that conclusion. Remember, one small epidemiologic study is not enough to draw conclusions about the fatality rate of infection. We need more data. But there is a glimmer of hope.
Excerpts from the study referenced in this interview:
We report the prevalence of antibodies to SARS-CoV-2 in a sample of 3,330 people, adjusting for zip code, sex, and race/ethnicity.
Under the three scenarios for test performance characteristics, the population prevalence of COVID-19 in Santa Clara ranged from 2.49% (95CI 1.80-3.17%) to 4.16% (2.58-5.70%). These prevalence estimates represent a range between 48,000 and 81,000 people infected in Santa Clara County by early April, 50-85-fold more than the number of confirmed cases.
Now, whether you chose to sit through that very long interview, here is another quote from a study by the same author, also a “Pre-Print” not yet peer-reviewed.
Individuals with age <65 account for 5%-9% of all COVID-19 deaths in the 8 European epicenters, and approach 30% in three US hotbed locations. People <65 years old had 34- to 73-fold lower risk than those ≥65 years old in the European countries and 13- to 15-fold lower risk in New York City, Louisiana and Michigan. The absolute risk of COVID-19 death ranged from 1.7 per million for people <65 years old in Germany to 79 per million in New York City.The absolute risk of COVID-19 death for people ≥80 years old ranged from approximately 1 in 6,000 in Germany to 1 in 420 in Spain.
So there are huge differences in mortality rates from country to country and region to region, including for different age groups.
WE DO NOT YET UNDERSTAND THESE DIFFERENCES NOR CAN WE SAFELY EXTRAPOLATE THESE NUMBERS TO MAKE PUBLIC HEALTH DECISIONS.
WE NEED MORE DATA.
OK, now here is an update to this post. The Stanford Study described above and discussed in the video of Dr. Ionnidis SHOULD BE WITHDRAWN. I have read serious methodological criticisms of this study. Here are a few of the major problems.
The study assumed a test specificity of 99.5% ( false positive rate of 0.5%) BUT an independent test of the test that was likely used (Chinese lab test vendor:Hangzhou Biotest Biotech) revealed 87% specificity (13% false positive rate). That is a huge problem as described in this analysis.
The sample was not truly a random population, they advertised on facebook for participants at a time when testing was not very available in Santa Clara County. If you had symptoms or had been exposed and heard about a free test would you enroll in the study? (you bet).
Very thoughtful and knowledgeable scientists have been analyzing how America can return incrementally to less restricted activity. It is very complicated, will vary from region to region, locality to locality, and will need constant assessment and modification. You can read one excellent report here.
That report, prepared by Johns Hopkins School of Public health, is titled Public Health Principles for a Phased Reopening During COVID-19: Guidance for Governors.
Here is an important excerpt.
The majority of models have shown that, in the absence of social distancing, COVID-19 has a reproduction rate of between 2 and 3 (though some models have shown it to be higher). This means that every person with the disease will spread it to 2 to 3 others, on average. To end an epidemic, control measures need to drive that number as far below 1 as possible. A vaccine can do that if and when it becomes available. But in the meantime, social distancing measures, combined with case-based interventions, are the key tools to maintaining the reproduction rate below 1. If the reproduction rate rises above 1, this means that epidemic growth has resumed. If that occurs, it may be necessary to reinitiate large-scale physical distancing. It is important to recognize that states will need to actively manage COVID-19 cases with great vigilance for the entire duration of the pandemic until a safe and effective vaccine is widely available.
And another:
There are still many gaps in scientific understanding about the transmission dynamics of SARS-CoV-2. But initial published data suggest that transmission of SARS-CoV-2 occurs primarily through prolonged, close contact. In studies that have monitored people with a known exposure to a confirmed case, household members, those who report frequent contact, and people who have traveled together or shared a meal are found to be at highest risk of infection. Other studies that attempt to reconstruct transmission chains among confirmed cases have also found that prolonged close contact is the source of most new infections. Some special settings have also been identified. Superspreading events have been linked to religious services, choir practice, and large family gatherings,among others. Congregate settings like cruise ships, institutions of incarceration, and long-term care facilities have also been the source of large outbreaks. These findings suggest that settings where close contact is minimal will be lower risk than settings with prolonged close contact.
The precursor to the report cited above can be read here.
Clearly, at-risk individuals (elderly, anyone with chronic illness) will need to have greater restrictions for longer periods of time. Everyone will need to be careful to follow guidelines to prevent infecting themselves and others. People living in densely populated areas that rely heavily on public transportation (example: New York Metropolitan area) have suffered the most and will continue to be hot zones until herd immunity is achieved. Large gatherings of people, particularly in confined areas with close proximity, remain high risk for contracting the illness. Remember, sitting at a table and eating or playing cards with an asymptomatic but infected person can result in everyone at the table getting infected. Remember the choir rehearsal in Washington where everyone likely became infected.
THIS WEBSITE PROVIDES INFORMATION FOR EDUCATIONAL PURPOSES ONLY. CONSULT YOUR HEALTH CARE PROVIDER FOR MEDICAL ADVICE.
Eat clean, drink filtered water, love, laugh, exercise outdoors in a greenspace, get some morning sunlight, block the blue light before bed, engage in meaningful work, find a sense of purpose, spend time with those you love, AND sleep well tonight.