Due to popular demand the producers of this terrific series are making it available again on line this weekend. If you have not taken advantage of this information you can do it here:
Replay (YouTube) | Broken Brain
Enjoy
Bob Hansen MD
Due to popular demand the producers of this terrific series are making it available again on line this weekend. If you have not taken advantage of this information you can do it here:
Replay (YouTube) | Broken Brain
Enjoy
Bob Hansen MD
The obesity epidemic requires a paradigm shift. Several medical myths stand in the way of taking the most effective steps to safely help patients lose weight. The most important myth relates to saturated fat. Saturated fat consumption does not contribute to cardiovascular disease. This must be understood and accepted by the medical community so that sound advice can be given.
A meta-analysis of prospective epidemiologic studies showed that there is no significant evidence for concluding that dietary saturated fat is associated with an increased risk of CHD or CVD.( Am J Clin Nutr. 2010 Mar;91(3):497-9. )
In fact, as early as 2004, Mozaffarian et. al. investigated the influence of diet on atherosclerotic progression in postmenopausal women with quantitative angiography and found that:
In multivariate analyses, a higher saturated fat intake was associated with a smaller decline in mean minimal coronary diameter (P = 0.001) and less progression of coronary stenosis (P = 0.002) during follow-up. (Am J Clin Nutr. 2004 Nov;80(5):1175-84)
In addition, they further found that:
Carbohydrate intake was positively associated with atherosclerotic progression (P = 0.001), particularly when the glycemic index was high.
Polyunsaturated fat intake was positively associated with progression when replacing other fats (P = 0.04)
These findings should come as no surprise given the basic science of atherosclerosis. Oxidized and glycated LDL stimulate macrophages to become foam cells initiating the creation of plaque. Cellular receptors that allow macrophages to ingest oxidized LDL are specific for oxidized LDL. These receptors do not recognize normal LDL to a significant degree.
Holovet et. al. studied the ability of oxidized LDL versus the Global Risk Factor Assessment Score (GRAS) to detect coronary artery disease. GRAS identified coronary artery disease 49% of the time, while oxidized LDL was correct 82% of the time.
In a large prospective study, Meisinger et al found that plasma oxidized LDL was the strongest predictor of CHD events when compared to conventional lipoprotein risk assessment and other risk factors for CHD.
Polyunsaturated fats are easily oxidized, saturated fats are not. It is the polyunsaturated fatty acids (PUFA) in the membrane of LDL particles that become oxidized and then initiate the cascade of inflammatory events leading to atherosclerosis. The major source of these PUFA in the American diet are “vegetable oils” (corn oil, soy oil etc.) rich in the omega-6 PUFA, linoleic acid.
So why is this important to understand relative to the obesity epidemic? Because the most effective weight loss “diet” is arguably a low carbohydrate/high fat (LCHF) diet. This approach does not require calorie counting. This approach has been demonstrated to spontaneously reduce caloric intake whereas low fat diets require calorie counting and result in persistent hunger.
When compared to low fat calorie restricted diets the LCHF approach has been equal or superior with respect to weight loss, insulin sensitivity, blood pressure reduction, and lipid profiles whenever these parameters have been measured.
But LCHF has not been embraced by the medical community due to the perceived dangers of saturated fat consumption and a low-fat ideology that lacks legitimate scientific evidence.
Once we dispel the mythology of saturated fat, the safety and efficacy of LCHF will be more readily accepted by physicians, the media and the lay public.
The nutritional villains in our society are highly refined and easily oxidized “vegetable oils” filled with pro-inflammatory omega-6 PUFA (linoleic acid), added sugar (especially HFCS) so prevalent in most processed foods and soft drinks, and the nutrient poor wasted calories of processed flour foods. These three culprits are responsible for our epidemics of obesity, insulin resistance and metabolic syndrome. These three conspire together to generate fatty liver disease, atherosclerotic plaque, and chronic inflammation.
When a LCHF approach is combined with eating only fresh whole foods and avoiding added sugar, refined flour, and unhealthy “vegetable oils”, we have the perfect recipe for our obesity epidemic.
The following references provide examples of studies that have demonstrated the efficacy, safety and usual superiority of the LCHF approach to weight loss.
Dig Dis Sci. 2007 Feb;52(2):589-93. Epub 2007 Jan 12. The effect of a low-carbohydrate, ketogenic diet on nonalcoholic fatty liver disease: a pilot study. Tendler D, Lin S, Yancy WS Jr, Mavropoulos J, Sylvestre P, Rockey DC Westman EC.
This new film created by a GP in UK, funded by small contributions, describes how elimination of added sugar and implementation of carbohydrate restriction can cure diabetes and result in weight loss. The film also covers how the low-fat craze, based on bad science (ignoring the full data) began with Ancel Keyes and evolved into arguably the worst public health disaster experienced by the modern world.
Ever wonder why the public is so confused about nutrition recommendations? Just follow the money and you will understand that most of the professional societies that publish nutrition articles are funded by big food companies that are trying to sell more sugar, refined carbs and junk food. I recently read an excellent post about this topic here:
The Vilest Villain: American Society of Nutrition
This theme is repeated by medical journals that are “The Official Journal of the Society of >>>>>>” Just fill in the blanks for just about any medical society. Funding comes from big pharmaceutical companies the same way that funding in the nutrition Journals comes from large (junk) “food” manufacturers.
Don’t get me wrong, there are plenty of very valuable, life-saving drugs out there.
But most chronic human disease in developed societies is generated by various combinations of poor nutrition, lack of exercise, disruption of circadian rhythm, inadequate restorative sleep, stress and lack of social support systems.
The obesity and diabetes epidemics continue to worsen yet the failed dietary advise of major health organizations is slow to respond to the data. Excess refined carbs (especially in the form of “food” made with flour) and added sugar (especially in the form of HFCS) are the major driving forces for obesity, diabetes and cardiovascular disease. Red meat is not the culprit, provided the meat is properly sourced (hormone and antibiotic free, grass fed) and cooked in a manner that does not create carcinogens and inflammatory mediators (cook with slow, low, moist heat, high temperature grilling and smoking cause problems, but that topic is for another post).
Americans consume an average 130 pounds per year of added sugar and 140 pounds per year of refined flour. Those are averages so there are many people who consume more. The added sugar is not the white stuff people put in their coffee. It comes in all sorts of forms but is found in energy drinks, soda, lattes and mochas, salad dressing, ketchup, canned soups, canned vegetables, white AND whole grain breads, pasta (even “whole grain”), crackers, breakfast cereal, just about any packaged food that has more than one ingredient on the label. These foods represent 70% of the American diet. The problems created by this situation are enormous and will bankrupt our “healthcare system”. This is a cultural and economic problem.
The solutions are simple but largely ignored in our society. We are creatures of habit and convenience.
Eat whole foods, nothing from a package that has more than one ingredient. Eat meat, seafood, poultry, fresh organic vegetables (6-9 servings per day), fresh organic fruits, and nuts. Meat should be hormone and antibiotic free (free range, grass fed). Seafood should be wild. Poultry should be free range and the eggs should come from free range chickens, ducks, geese.
Do not worry about eating fat as long as it comes from healthy animals and sources such as coconut oil, extra-virgin olive oil, avocado oil and clarified butter (ghee).
Do not use any “vegetable” oils (corn, soy, and other oils from grains or seeds) The vegetable oils are highly refined and inflammatory. They contain easily oxidized omega 6 fats that feed the production of inflammatory mediators in your body and create oxidized LDL leading to atherosclerosis.
Exercise daily, preferably outside in a green space. Twice per week spend 20-30 minutes doing resistance training (lift weights, work against the resistance of bands, use your own body weight doing pushups, pull-ups etc)
Reduce stress with mediation, yoga, tai chi, dancing, engaging in fun sports and social activities. Walk on the beach, by a lake, river or stream, in the woods, listen to music.
Get some sunshine regularly especially during the morning to get your circadian rhythm in order and to produce adequate amounts of vitamin D.
Spend time with family, friends and colleagues who are supportive and fun to be around.
Sleep in the dark.
Get at least 7 hours of sleep per night. Avoid TV, computer screens and other electronic devices for at least 2 hours before bedtime.
Unplug from the internet, email, etc on a regular basis.
We evolved as hunter-gatherers.
Peace
Bob Hansen MD
Yesterday I posted a comment on Medscape after reading an article Longtime Dietary Fat Advice Unsupported by Data: Analysis . Medscape is a website with articles and news written for physicians and other health professionals. Anyone can access this information by creating a user name and password, there is no fee.
Here is my comment. It is long and technical. I will provide an explanation in lay terms after quoting myself.
Sugar, especially HFCS (high fructose corn syrup), used in so many foods is more inflammatory than saturated fat. Grass fed meat from ruminants has a fatty acid mix that is exactly the same as wild game, which we evolved to eat, along with tubers, green leafy vegetables, and fruit in season. Excess refined fructose intake AND use of modern refined “vegetable oils” along with non-healthy grains combine to cause excess caloric intake, NAFLD (non-alcoholic fatty liver disease), obesity, metabolic syndrome and CAD (coronary artery disease). N6 PUFA (omega six polyunsaturated fatty acids) are easily oxidized. N3 PUFA (omega 3 fatty acids) despite greater number of double bonds are protected from oxidation in cell and Lipoprotein membranes by plasmalogens as opposed to linoleic acid which is not easily incorporated into plasmalogens. The PUFA in vegetable oils (linoleic acid) is the FA (fatty acid) that is oxidized on LDL particles and remnant particles, stimulating monocytes to transform to macrophages and then foam cells. The USDA, ADA and AHA have had it upside down for decades and they still fail to admit folly. We evolved for > 1 million years without grains and they have contributed to disease. Per calorie fresh vegetables have five times the amount of fiber compared to whole grains. We do not need grains and would be better without them. They contain anti-nutrients and wheat, hybridized in the 1980s to a storm resistant dwarf plant, now has 50 times more gluten/gliadin than the old wheat. This has generated more gluten intolerance and celiac. Our greatest nutritional threats to public health include refined sugar, carbohydrates predominantly from grains and refined vegetable oils. Vegetable oils are not healthy, we did not evolve to eat them. N3 FAs are anti-inflammatory but have been competing in our diets with a sea of inflammatory N6 PUFA from unnatural refined and easily oxidized “vegetable oils”. Even though PUFA can reduce LDL-C they wreak havoc by creating ox-LDL particles which initiate the cascade of atherosclerosis. Substituting SFA (saturated fatty acids) with PUFA results in increased levels of Lp(a) and oxLDL in humans, not a good thing. Close the feed lots, stop government subsidy of corn, wheat, dairy and soy, eat meat from grass fed ruminants, wild seafood, fresh organic vegetables and fruits in season. Nibble on tree nuts. Stop creating carcinogens with high dry heat cooking methods and we will watch obesity, insulin resistance, metabolic syndrome and atherosclerosis melt away.
That was my comment. Here is some explanation.
I have previously discussed the pro-inflammatory nature of refined “vegetable oils”. “Vegetable oils” are actually not from vegetables, they are from grains, seeds and legumes. The two major sources of excess omega six polyunsaturated fats in the American diet are corn oil and soy oil marketed by various brand names such as Wesson. They are major components of margarine and other butter substitutes and are present in most salad dressings. Most salad dressings sold in our supermarkets contain high levels of easily oxidized unhealthy refined “vegetable oils” and HFCS. The use of these salad dressings converts a healthy salad into a vector for disease.
The major source of caloric sweeteners in our food and beverages is high fructose corn syrup. Both corn (oil and sugar) and soy predominate our processed food supply because they are cheap. They are cheap because our tax dollars subsidize their production. This subsidy started during the Nixon administration. Once a food subsidy is put in place it is very difficult to eliminate, Big Agriculture provides a deep pocket for lobby money and our elected officials from the mid-west bread-basket respond to $$.
Another major source of disease causing elements in the standard American diet is highly refined flour from wheat. Doctors Davis and Perlmutter discuss the problems associated with wheat-flour foods in their books Wheat Belly and Grain Brain respectively. The production of wheat has also been subsidized since the Nixon administration.
Wheat is not what it used to be. A new dwarf hybrid wheat has predominated the US market since the 1980s. Bread and pasta are not what they used to be when great grand-mother made her own bread and pasta in the kitchen from coarsely ground whole flour. But even if we all went back to making our own whole-grain bread and pasta from locally ground pre-1980s wheat, bread, pasta and pastry would still present a health risk because of issues related to intestinal permeability, auto-immune disease (now epidemic in the USA), and the presence of nasty lectins and phytates (discussed in my manifesto and previous posts).
The Medscape comment quoted above describes adverse consequences caused by replacing saturated fat in the diet with “vegetable oils”. This is a complex subject and I will try to be brief for now but promise to expand on this in a future post.
Many factors contribute to atherosclerosis, heart attack and stroke. Sedentary lifestyle, stress, inadequate restorative sleep, smoking and poor dietary choices top the list. These factors also contribute to obesity, diabetes, metabolic syndrome, insulin resistance and many cancers.
DIETARY FACTORS:
The combination of sugared foods and beverages (predominantly sweetened with HFCS), refined flour foods, and excess consumption of the PUFA in “vegetable oils” TOGETHER contribute to the formation of plaque in the walls of our arteries (atherosclerosis).
How does this happen?
LDL (low density lipoprotein) is a particle that transports cholesterol and triglycerides through our blood to our organs. This particle is comprised of a core and a surrounding membrane. Here is a picture.

The core contains cholesterol in a storage form (esters) and triglycerides. The outer membrane includes a large protein called apoprotein B-100, “free” cholesterol molecules and phospholipids. The phospholipids contain fatty acids, including PUFA.
LDL has been demonized as “the bad cholesterol” and that demonization has mislead the public.
LDL is the major lipoprotein in our blood but there are others that have different names.
Cholesterol is cholesterol, whether it is carried in LDL or HDL. When carried in the core of a lipoprotein it is carried as a cholesterol ester. 80% of the cholesterol in an LDL particle is carried as an ester in the core. 20% is carried as “free” cholesterol on the outer surface or membrane.

HDL (high density lipoprotein) is smaller and denser. HDL has been called “the good cholesterol”, another misnomer.
HDL particles, when they are functioning correctly can protect us from atherosclerosis but in patients with diabetes, obesity, and insulin resistance, HDL particles do not function well and in fact probably contribute to disease. (More about that in a future post)
But back to LDL.
Although the risk of cardiovascular disease is correlated with the amount of cholesterol carried by LDL in our blood (referred to as LDL-C), the total amount of cholesterol shuttled by LDL particles is much less relevant than one would be led to believe given the great use of statin drugs to lower LDL-C.
The short version is as follows.
Compared to LDL-C, a much better predictor of cardiovascular disease is the amount of “modified” LDL particles circulating in the blood. Oxidized LDL particles are one form of “modified LDL”. LDL can also be modified by excess blood sugar levels (especially from HFCS). This modification is referred to as glycosylated or glycated LDL. In this latter form of modification, the major protein on the outer membrane of the LDL particle (apo B 100 in the picture above) becomes attached to a sugar and the result is an LDL particle that is not easily cleared by normal processes. The modified LDL is not “recognized” by the LDL receptors that act as entry points into our cells for proper processing. The result is that the glycated LDL particles circulate longer and are more likely to use up their anti-oxidants (Vitamin E and Co-enzyme Q 10).
As a result glycated LDL are more likely to become oxidized. That is not good because oxidized LDL sets up a cascade of unhealthy events.
The portion of the LDL particle that becomes oxidized is the fat (fatty acid) from “vegetable oil”, specifically the fatty acid called linoleic acid. This fatty acid has two double bonds making it more likely to be oxidized than for example oleic acid, the major fatty acid in extra virgin olive oil which has only one double bond.
The double bonds between the carbons in the fatty acids are unstable and easily oxidized. The single bonds in saturated fat do not get oxidized.
All other things being equal (and you will see that they are not), the more double bonds in a fatty acid the greater chance for oxidation.
Here is a picture showing the linoleic acid, also called linoleate, on the outer membrane of the LDL particle.

And here is a picture that shows the phospholipids that contain the linoleic acid.

Let’s say it again. The fatty acid found in “vegetable” oil, linoleic acid, is easily oxidized because it has two double bonds.
Saturated fats are not oxidized because they contain no double bonds.
The part of the LDL particle that becomes oxidized is the fatty acid that comes from “vegetable oils”.
A particular kind of immune cell (white blood cells called monocytes) have special receptors for oxidized LDL particles. When ox-LDL are “seen” by these monocytes, the monocytes become transformed into macrophages. Macrophages are designed to destroy bacteria that invade our bodies. The oxidized LDL particles resemble the structures of invading bacteria. The macrophages, with very specialized receptors for oxidized LDL, “swallow” the LDL particles and release toxic chemicals to destroy “the invader”. The macrophages then become “foam cells” in the walls of our arteries, initiating the creation of plaque. Here is a picture.
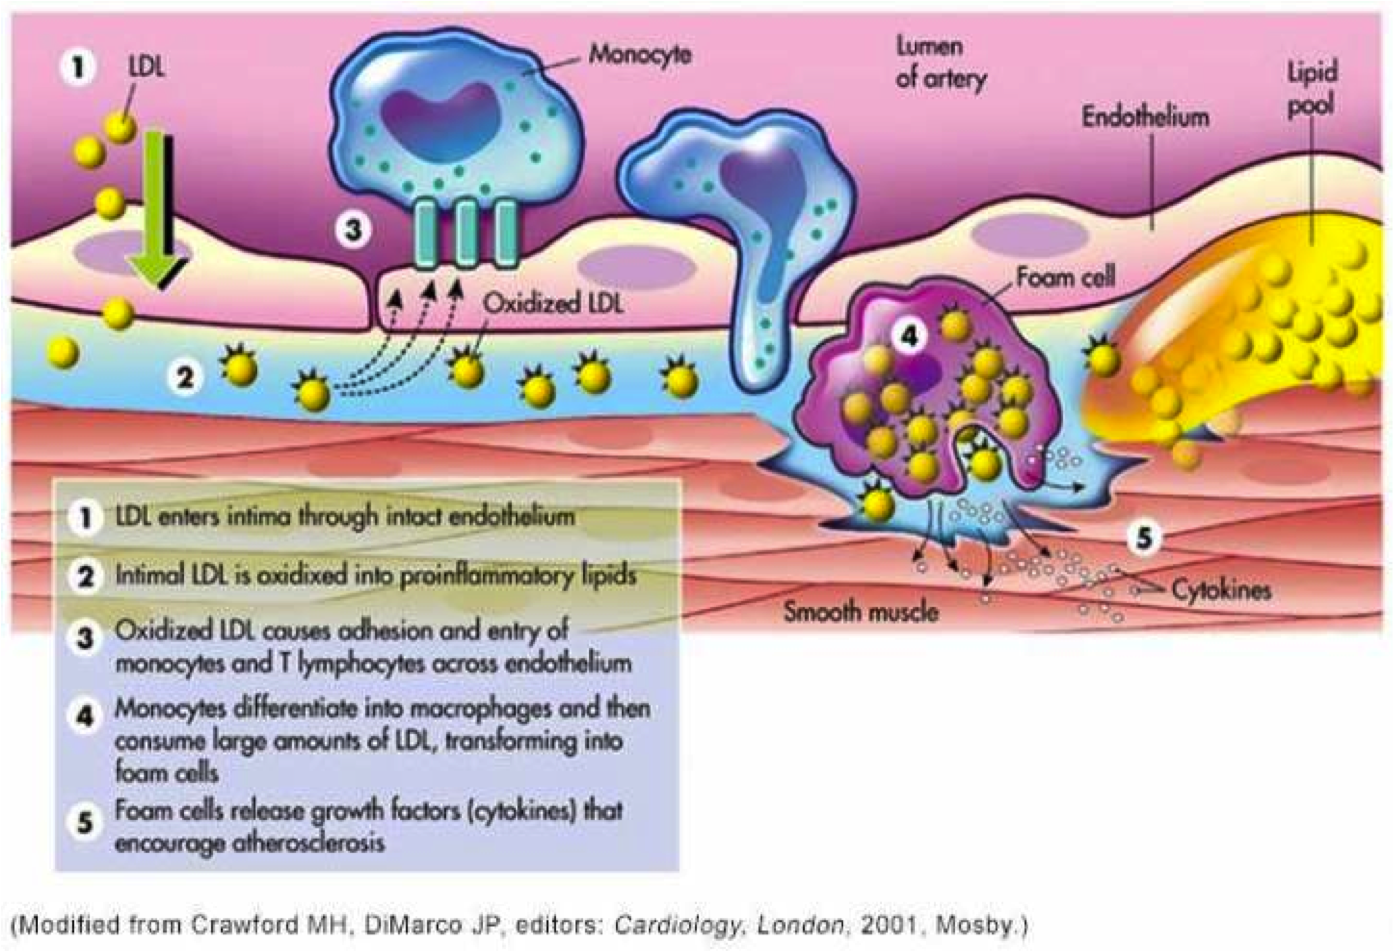
This picture depicts the oxidation occurring in the wall of the artery after LDL particles have penetrated the wall. However LDL particles can and do become oxidized while still circulating in the blood and these oxidized particles can stimulate monocytes to transform into macrophages and gobble up the oxidized or modified LDL while these particles are still circulating in the blood.
How and whether unmodified LDL particles cross the wall of arteries into the “sub-endothelial” area remains an unsolved complex issue. The picture above implies that LDL particles simply move across the endothelial cells that line the wall of the artery but that is a presumption.
Clearly, macrophages that have “swallowed” modified LDL particles have mechanisms to work their way between the junctions formed by adjacent endothelial cells.
This is an important distinction because many cardiologists believe that what drives atherosclerosis is a mass effect. The greater the number of LDL particles, the more likely they are to cross the endothelial barrier, get oxidized and retained and start the process of plaque formation. However the process is much more complex and not clearly understood.
We do not yet know or understand completely the factors that influence the permeability of the endothelium to Lipoprotein particles. We do know that modified (oxidized and glycated LDL) disrupt the protective surface of endothelial cells which is called the glyocalyx. Other factors that disrupt the glyocalyx include high blood sugars, dramatic fluctuations in blood pressure (too high or too low), oxidative stress, infections, and circulating endotoxin (which is governed by intestinal permeability).
It is clear from several studies that modified (oxidized) LDL as a single variable predicts cardiovascular disease and heart attacks with much greater accuracy than LDL-C (total cholesterol content of LDL particles). It is also clear that monocyte receptors are specific for modified LDL and that the process that initiates the cascade of events that leads to plaque formation involves the interaction between modified lipoprotein particles and the immune system (monocytes).
Now here is another twist.
Omega 3 fatty acids in fish oil are considered “heart healthy”. They help prevent heart attacks and strokes. They also decrease inflammation throughout the body thereby producing many health benefits.
BUT OMEGA 3 FAT HAS MORE DOUBLE BONDS THAN OMEGA 6 FAT (LINOLEIC ACID) YET THEY HELP PROTECT THE HEART. HOW CAN THAT BE?
How do they avoid contributing to atherosclerosis? Are they not even more readily oxidized than linoleic acid?
The simple answer is no.
The major reason is that the omega three fatty acids are protected by “plasmalogens” which are important components of our LDL particle outer membranes. Plasmalogens are found in the membranes of lipoprotein particles and in the membranes of human cells. Because of their chemical structures, omega three fats are easily incorporated into plasmalogens which protect the double bonds of omega three fats from oxidation. Linoleic acid, the predominant component of “vegetable oils” is not easily incorporated into the protective arms of plasmalogens.
This selective protection is well described on pages 141-142 of “The Fats of Life”, written by Dr. Glen Lawrence and published in paperback in 2013. (link below)
I asked Dr. Lawrence about this issue in an email and here was his response.
“The omega-3 fatty acids are preferentially incorporated into plasmalogens, which act as antioxidants due to the double bond adjacent to the ether linkage of these phospholipids. This structure would tend to scavenge free radicals or reactive oxygen species near the surface of the membrane, rather than allowing them to penetrate deeper in the membrane where the double bonds of PUFA are located. This makes any polyunsaturated fatty acids attached to the plasmalogens more resistant to oxidation than they would be in a regular phospholipid. See pp 141-142 of The Fats of Life. The shorter chain and less unsaturated linoleic acid does not tend to be incorporated into plasmalogens.”
In summary:
These are the major points, but there is allot more to discuss. Substituting “vegetable oils” for saturated fat in our diets not only increases the amount of oxidized LDL but also increases a dangerous lipoprotein called Lp(a). On third of Americans have an amount of Lp(a) that is considered “high risk” for heart attack and stroke. More about that in a future post.
Then there is the process of an actual heart attack or stroke which involves disruption of plaque and the creation of a blood clot that ultimately disrupts the flow of blood and the death of heart or brain tissue. The susceptibility of plaque to disruption is a huge topic that involves high blood pressure, diabetes, insulin resistance, oxidative stress, inadequate sleep, and stress to name a few. So much more to discuss.
But getting back to the title of this post, why don’t you ask your elected representatives why our tax dollars continue to subsidize nutritional root causes of death, disability and disease?
Here are some links to papers and books that support the discussion above.
Circulating Oxidized LDL Is a Useful Marker for Identifying Patients With Coronary Artery Disease
Erythrocyte fatty acid profiles can predict acute non-fatal myocard… – PubMed – NCBI
Low-density lipoprotein subclass patterns and risk of myocardial in… – PubMed – NCBI
Subendothelial Lipoprotein Retention as the Initiating Process in Atherosclerosis
Effects of linoleate-enriched and oleate-enriched diets in combinat… – PubMed – NCBI
Enhanced oxidative susceptibility and reduced antioxidant content o… – PubMed – NCBI
Susceptibility of small, dense, low-density lipoproteins to oxidati… – PubMed – NCBI
Modulation of Endothelial Glycocalyx Structure under Inflammatory Conditions
Oxidized Lipoproteins Degrade the Endothelial Surface Layer
S1P Control of Endothelial Integrity
Mechanical control of the endothelial barrier. – PubMed – NCBI
Therole of actin-binding proteins in the control of endothelial bar… – PubMed – NCBI
The Fats of Life, Dr. Glen Lawrence
Functions of plasmalogen lipids in health and disease
Finally a quote from the Dali Lama (thanks to my cousin Diane for bringing this to my attention).
“Man. Because he sacrifices his health in order to make money. Then he sacrifices money to recuperate his health. And then he is so anxious about the future that he does not enjoy the present, the result being that he does not live in the present or the future, he lives as if he is never going to die, and dies having never really lived.”
Eat clean, live clean, sleep well, exercise wisely, rest often, enjoy the company of loved ones, spend time outdoors and live in the present.
BOB
In my first post about sugar I discussed increased cardiovascular risk associated with consumption of added sugar, sweetened foods and beverages. This post will discuss other risks including childhood obesity and adult obesity, diabetes and Metabolic syndrome.
The marketing efforts directed at young children by soda producers and fast food restaurants is astounding. You can view a video produced by a concerned mother here.
Some highlights of the video include:
You can read more about this topic here. Nutritional Content of Food and Beverage Products in Television Advertisements Seen on Children’s Programming.
So what’s all the fuss? Where is the data to support a connection between sweetened beverages, sweetened foods and obesity, diabetes and metabolic syndrome?
Let’s start with a study by Gitanjali Singh and associates from Harvard School of Public Health reported here, the Epidemiology and Prevention/Nutrition, Physical Activity and Metabolism 2013 Scientific Sessions. I read about this on Medscape published on-line. You must establish a user name and password to access these reviews, written for physicians and health professionals.
They reported that drinking large amounts of sugar sweetened beverages (SSBs) was associated with an increased body-mass index (BMI). Increased BMI is associated with deaths from diabetes, cardiovascular disease and cancer, so the authors calculated deaths associated with consumption SSBs from diabetes, CVD and cancer.
The researchers found that in 2010
“132,000 deaths from diabetes, 44,000 deaths from CVD, and 6000 deaths from cancer in the world could be attributed to drinking sugar-sweetened soft drinks, fruit juice, or sports beverages.”
“As part of the Global Burden of Disease study, the researchers obtained data from 114 national dietary surveys, representing more than 60% of the world’s population.
Based on data from large prospective cohort studies, they determined how changes in consumption of sugary drinks affected BMI, and next, how elevated BMI affected CVD, diabetes, and 7 obesity-related cancers (breast, uterine, esophageal, gallbladder, colorectal, kidney, and pancreatic cancer). Using data from the World Health Organization, they calculated the number of deaths from BMI-related CVD, diabetes, and cancer for men and for women aged 20 to 44, 45 to 64, and 65 years and older.”
Mexico had the highest number of deaths and Japan the lowest number of deaths attributed to the risk factor of sweetened beverage consumption. The USA had an estimated 25,000 deaths per year associated with drinking sugar sweetened beverages.
Medscape quoted Rachel K. Johnson, Ph.D. an AHA spokesperson.
“The evidence base that sugar-sweetened beverages are associated with excess weight gain is well established; what these investigators have done is to take it a step further by saying the excess weight gain that is attributable to sugary drinks actually increases the risk of death from diabetes, CVD, and cancer,”
The obesity literature is in agreement that consuming beverages with calories does not result in a decrease in an equivalent amount of calories from solid food consumption. In fact studies of humans demonstrate that sugar sweetened beverages increase the total amount of calories consumed by an amount equal to the calories in the beverage. This is added calories that do not produce satiety. This is why my Manifesto recommends drinking only water, coffee, tea, and no sweetened beverages.
Here is a discussion about sugar added beverages vs sweetened solid foods.
“a higher consumption (10 g/d) of added sugars from liquid sources was associated with 0.04 mmol/L higher fasting glucose, 2.3 pmol/L higher fasting insulin, 0.1 unit higher homeostasis model assessment of insulin resistance (HOMA-IR), and 0.4 unit lower Matsuda-insulin sensitivity index (Matsuda-ISI) in all participants (P < 0.01).”
Translation, just 10 grams (1/3 ounce) of added sugar from beverages increased fasting blood sugar, increased fasting insulin, worsened Insulin resistance. Insulin resistance is the precursor to diabetes. This is a chronic inflammatory state.
How much sugar is in a can of coke? Look here. How Much Sugar in Sodas and Beverages? 39 grams in a 12 oz bottle of coke, 79 grams in a 7-Eleven 32 oz Big gulp, 128 grams in a 7-Eleven 44 oz Super Gulp. 77 grams in a 20 oz bottle of Mountain Dew, But it only takes 10 grams a day to cause harm.
” liquid added sugars were a risk factor for the development of impaired glucose homeostasis and insulin resistance over 2 y among youth at risk of obesity.”
But let’s look at another study.
A meta-analysis published in 2010 reported that consumption of just one or two sugar-sweetened beverages per day is associated with a 26% greater risk of developing type 2 diabetes and a 20% increased risk of developing metabolic syndrome. Abstract
They concluded:
“In addition to weight gain, higher consumption of SSBs (sugar sweetened beverages) is associated with development of metabolic syndrome and type 2 diabetes. These data provide empirical evidence that intake of SSBs should be limited to reduce obesity-related risk of chronic metabolic diseases”
Malik VS, Popkin BM, Bray GA, et al. Sugar-sweetened beverages and risk of metabolic syndrome and type 2 diabetes: A meta-analysis. Diabetes Care 2010: 33:2477–2483.
At the time of this study publication, cities and states were introducing legislation for “soda taxes” on sugar-sweetened beverages. There were also attempts to make sodas and sugar drinks ineligible for food stamp purchases. See the discussion here.
That same year the American Journal of Clinical Nutrition published a study Carbohydrate quantity and quality and risk of type 2 diabetes in the European Prospective Investigation into Cancer and Nutrition–Netherlands (EPIC-NL) study
We investigated the associations of dietary glycemic load (GL), glycemic index (GI), carbohydrate, and fiber intake with the incidence of type 2 diabetes.
They followed 37,846 participants for a mean follow up period of 10 years.
They concluded:
“Diets high in GL, GI, and starch and low in fiber were associated with an increased diabetes risk. Both carbohydrate quantity and quality seem to be important factors in diabetes prevention. “
There is plenty of low quality carbohydrate in the sodas featured above. And there is no fiber to slow the absorption of the sugar. You might as well start an IV and deliver 128 grams of super-gulp sugar directly into the blood.
In 2010 a Health Policy Report concerning the consumption of sweetened beverages was published in the New England Journal of Medicine.
The Public Health and Economic Benefits of Taxing Sugar-Sweetened Beverages – NEJMhpr0905723
They open up by stating:
Evidence that a tax on sugar sweetened beverages reduces the obesity rate: a meta-analysis.
This one concluded that:
Six articles from the USA showed that a higher price could also lead to a decrease in BMI, and decrease the prevalence of overweight and obesity.
More studies from the search “sugar AND tax”.
A substantial tax on sugar sweetened drinks could help reduce obesity.
The sugar-sweetened beverage wars: public health and the role of the beverage industry.
Taxing sugar-sweetened beverages: the fight against obesity.
Despite all of this discussion there has not been a “sugar tax” on sweetened beverages and here are several reasons.
Taxes on sugar-sweetened beverages: results from a 2011 national public opinion survey.
“Consumption of sugar-sweetened beverages including non-diet sodas, sport drinks, and energy drinks has been linked with obesity. Recent state and local efforts to tax these beverages have been unsuccessful. Enactment will be unlikely without public support, yet little research is available to assess how to effectively make the case for such taxes.
The objectives were to assess public opinion about arguments used commonly in tax debates regarding sugar-sweetened beverages and to assess differences in public opinion by respondents’ political party affiliation.
Findings indicated greater public agreement with anti- than pro-tax arguments. The most popular anti-tax argument was that a tax on sugar-sweetened beverages is arbitrary because it does not affect consumption of other unhealthy foods (60%). A majority also agreed that such taxes were a quick way for politicians to fill budget holes (58%); an unacceptable intrusion of government into people’s lives (53.8%); opposed by most Americans (53%); and harmful to the poor (51%). No pro-tax arguments were endorsed by a majority of the public. Respondents reported highest agreement with the argument that sugar-sweetened beverages were the single largest contributor to obesity (49%) and would raise revenue for obesity prevention (41%).”
So the relationship between sugar sweetened beverages and diabetes, obesity and metabolic syndrome seems well established but as a public policy issue there has been no traction on taxation remedies. And as the video above demonstrates, Coke and Pepsi have more than a foot in the door in our school systems and our homes (TV adds).
You can make a difference. vote here Tell the Soda Industry to Use Their Influence to Combat Childhood Obesity
A future post will discuss artificial sweeteners (diet beverages) which unfortunately also have a dismal track record.
Until next time,
Peace
Bob Hansen MD
Sugar affects the pleasure centers of the brain in a manner much the same as cocaine, heroin, and other addictive substances. In that respect Americans are addicted to sugar. The average American consumes 136 pounds of added sugar per year. This includes 68 pounds of high fructose corn syrup (HFCS) and other corn-derived sweetener. These figures do not include the amount of natural sugar found in whole foods. These figures cover only the sugar added to food and beverages to make them sweeter.
From wikipedia:
“Sugar is the generalized name for a class of chemically-related sweet-flavored substances, most of which are used as food. They are carbohydrates, composed of carbon, hydrogen and oxygen. There are various types of sugar derived from different sources. Simple sugars are called monosaccharides and include glucose (also known as dextrose), fructose and galactose. The table or granulated sugar most customarily used as food is sucrose, a disaccharide (in the body, sucrose hydrolyses into fructose and glucose). Other disaccharides include maltose and lactose. Chemically-different substances may also have a sweet taste, but are not classified as sugars. Some are used as lower-calorie food substitutes for sugar described as artificial sweeteners.”
“The most widely used varieties of HFCS are: HFCS 55 (mostly used in soft drinks), approximately 55% fructose and 42% glucose; and HFCS 42 (used in beverages, processed foods, cereals, and baked goods), approximately 42% fructose and 53% glucose”
also from Wikipedia:
“It used to be believed that sugar raised blood glucose levels more quickly than did starch because of its simpler chemical structure. However, it turned out that white bread or French fries have the same effect on blood sugar as pure glucose, while fructose, although a simple carbohydrate, has a minimal effect on blood sugar. As a result, as far as blood sugar is concerned, carbohydrates are classified according to their glycemic index, a system for measuring how quickly a food that is eaten raises blood sugar levels, and glycemic load, which takes into account both the glycemic index and the amount of carbohydrate in the food.[60]”
Our blood sugars (glucose level measured as milligrams per deciliter or mg/dl) rise after every meal or snack and our body responds with the secretion of insulin from the pancreas to enable efficient processing of the sugar. Insulin facilitates the uptake of glucose into cells for utilization as energy and storage as starch (glycogen) or fat. Since glycogen storage capacity in the human body is relatively small (equivalent to two hours of hard labor) and filled quickly, most caloric intake that is not used immediately for work gets stored as fat.
Diabetics have higher blood sugars than “normal” people after an overnight fast as well as after a meal. But the definition of a “normal” fasting blood sugar as compared to a diabetic or “pre-diabetic” level is quite arbitrary. Likewise the definition of a “normal” blood sugar 2 hours after swallowing 75 grams of sugar ( oral glucose tolerance test or OGTT) is also quite arbitrary.
Now the story becomes alarming. Blood sugar levels measured 2 hours after a challenge with 50 or 75 grams of oral sugar intake that are below the diabetic range are associated with a significantly increased risk of heart attack and stroke. Likewise, hemoglobin A1c levels (A1c) below the diabetic range are also associated with increased risk of heart attack. Hemoglobin is the protein in red blood cells that carries and delivers oxygen throughout our bodies. A1c is a measurement of the % hemoglobin that has a molecule of sugar attached to it. A1c is thought to reflect the average amount of blood sugar during the prior 3 months (the average life of a red blood cell is 3 months). A1c is also called glycated hemoglobin.
So let’s discuss some data.
The Whitehall study followed 17,869 male civil servants aged 40-64 in England for 33 years. They measured the blood sugar 2 hours after consumption of 50 grams of glucose at the start of the study and recorded death from all causes, cardiovascular causes, and respiratory causes and cancers during the 33 year period. They found a direct linear relationship between the baseline 2 hour blood sugar measurement and the risk of coronary death over 33 years. The higher the blood sugar two hours after the sugar drink, the greater the risk of death from a cardiac event. This relationship held true for blood sugars starting at 83 mg/dl (considered normal). There was a dose response relationship between 83 mg/dl and 200 mg/dl. The linear relationship was attenuated by 45% after adjustment for baseline coronary heart disease, BMI, systolic blood pressure, blood cholesterol, smoking, physical activity, lung function and employment grade. They also found that glucose intolerance (post-load blood glucose level 96-200 mg/dl) is associated with increased mortality risk from all causes, stroke, and respiratory disease but not all cancers. At the time of this study publication diabetes was defined as a two hour blood sugar response greater than 200 mg/dl, responses between 96 and 200 were labeled glucose intolerance.
They stated:
Our findings are consistent with recent meta-analyses of post-load glucose and CVD mortality that have assembled results from diverse population-based studies of non diabetic subjects and shown the effect of glucose intolerance on risk over median follow-up of 9-12 years.
Relation between blood glucose and coronary mortality over 33 years in theWhitehall Study.
A study in 2009 showed that patients who did not meet the ADA definition of diabetes (2 hour blood sugar > 140 mg/dl using 75 gm of glucose) but had elevated one hour glucose tolerance test (> 155 mg/dl) had “sub clinical inflammation, high lipid ratios and insulin resistance.” These translate into increased cardiovascular risk.
Inflammation markers and metabolic characteristics of subjects with one-hour plasma glucose levels
Hemoglobin A1c is a measurement of the amount of sugar attached to the hemoglobin protein in the red blood cells that carry oxygen in the blood. It is thought to reflect an average blood sugar level during the previous 2-3 months. A1c > 6.5% is considered diagnostic for diabetes. But cardiovascular risk increases at A1c levels well below the level associated with diabetes. In one non-diabetic adults with A1c below 5% had the lowest rates of cardiovascular disease. Cardiovascular disease and death increased by 24 % for every 1% rise above A1c of 5% in non-diabetics.
In another study heart disease risk increased as A1c rose above 4.6%, a level that corresponds to an average blood sugar level of 86 mg/dl, remarkably close to the threshold of 83 mg/dl found in the Whitehall study.
“In non diabetic adults, HbA1c level was not related to CHD risk below a level of 4.6% but was significantly related to risk above that level (P<.001). In diabetic adults, the risk of CHD increased throughout the range of HbA1c levels. In the adjusted model, the Risk Ratio of CHD for a 1 percentage point increase in HbA1c level was 2.36 (95% CI, 1.43-3.90) in persons without diabetes but with an HbA1c level greater than 4.6%. In diabetic adults, the Risk Ratio was 1.14 (95% CI, 1.07-1.21) per 1 percentage point increase in HbA1c across the full range of HbA1c values.”
In other words, A1c level of 5.6% vs 4.6% was associated with more than doubling the risk of CHD. That is a profound difference. (Statin drugs reduced risk of cardiac mortality by 13% in studies that mixed primary and secondary prophylaxis populations)
In a study that followed 11,092 adults without diabetes or cardiovascular disease for 15 years the associations between A1c at baseline and the development of diabetes, coronary artery disease and stroke were evaluated.
Multivariate-Adjusted Hazard Ratio
A1c at baseline coronary disease risk diabetes risk stroke risk
<5% 0.96 (0.74-1.24) 0.52 (0.40 to 0.69) 1.09 (0.67-1.76)
5% to < 5.5%: 1.00 (reference) 1.00 (reference) 1.00
5.5% to < 6%: 1.23 (1.07-1.41) 1.86 (1.67 to 2.08) 1.23 (1.07-1.41)
6% to < 6.5%: 1.78 (1.48-2.15) 4.48 (3.92 to 5.13) 1.78 (1.48-2.15)
>= 6.5%: 1.95 (1.53-2.48) 16.47 (14.22-19.08) 1.95 (1.53-2.48)
So below the range for diabetes, A1c levels in the range of 6 to <6.5% are associated with an increased the risk of heart disease and stroke by 78% an astounding amount in comparison to the purported effects of blood cholesterol. But this study had another interesting result.
“The association between the fasting glucose levels and the risk of cardiovascular disease or death from any cause was not significant in models with adjustment for all co-variates as well as glycated hemoglobin. For coronary heart disease, measures of risk discrimination showed significant improvement when glycated hemoglobin was added to models including fasting glucose.”
In other words, when A1c was included in a mathematical model of multiple risk factors the effect of fasting glucose on risk of cardiovascular disease disappeared. There are theoretical reasons to explain this but that is the topic of another post.
The authors summarized by saying.
“In this community-based population of non diabetic adults, glycated hemoglobin was similarly associated with a risk of diabetes and more strongly associated with risks of cardiovascular disease and death from any cause as compared with fasting glucose.”
Glycated Hemoglobin, Diabetes, and Cardiovascular Risk in Nondiabetic Adults.
Now some folks are concerned that the 2 hour blood sugar response to swallowing 75 grams of sugar does not reflect the reality of a real meal. Although the literature has revealed that the results of an OGTT is a better predictor of cardiovascular events and all-cause mortality than fasting blood glucose (FBG) the OGTT is not a real meal and represents only a surrogate for a real meal. So a group of researchers decided
“To evaluate whether postprandial blood glucose predicts cardiovascular events and all-cause mortality in type 2 diabetes in a long term follow-up taking into account A1c and the main cardiovascular risk factors.”
They found that both A1c and blood sugars measured 2 hours after lunch were predictors of cardiovascular events and death.
Remember, association does not prove causation. So what is going on here? How could higher blood sugar, even below the levels associated with diabetes, cause heart attacks, strokes and death?
Many complex mechanisms are likely involved. Three to consider include
Recall that LDL particles carry cholesterol and fat (fatty acids) in the blood to deliver both cholesterol and fat to cells that need them. The various cells of our body have LDL receptors that engage the particle for docking and delivery.
As mentioned in previous posts, modified LDL particles are great stimulators for the development of atherosclerotic plaques in the walls of arteries. Modified LDL particles stimulate cells of the immune system to transform and become disposal units for the modified LDL. Unfortunately, the disposal process leads to deposition of the remnants of this process in the wall of our artery, creating a plaque (atherosclerotic plaque).
LDL particles can be modified by oxidation (the polyunsaturated fats on the surface of LDL become oxidized, remember saturated fats are not easily oxidized ) or by having sugar attach to the protein that envelopes the LDL particle (creating glycated LDL). Both forms of modified LDL (glycated and oxidized) are involved with atherosclerosis. Both forms stimulate the immune system to react as described above.
So far we have discussed the data for “normal blood sugar” levels wreaking havoc with respect to heart attack and stroke, but the same applies to other potential forms of damage including peripheral artery disease, kidney failure, peripheral neuropathy, cataracts, and dementia to name a few. All of these involve increased risk associated with higher blood sugar levels, inflammation and probably the glycation of various proteins in the body that are essential to normal function of our cells. When this glycation occurs we refer to the glycated proteins as advanced glycation end products (AGEs).
Glycosylation weakens the tight junction between the endothelial cells that line the arteries making them leaky and vulnerable to tears. Glycosylation of proteins in the lens of the eye creates cataracts. Glycosylation in the tiny blood vessels in the back of the eye makes them leak and bleed and can cause diabetic retinopathy, a leading cause of blindness. Glycosylation of the collagen in the skin makes skin less elastic and stiffer (aging skin). Glycosylation of collagen in your joints impairs joint mobility and can lead to arthritis. Glycosylation of the elastic tissue in lungs can impair pulmonary function.
AGEs disrupt the normal function of cells, no matter what organ is involved, and as AGEs accumulate we literally age. The human body has a way to deal with AGEs. There are mechanisms to rid ourselves of AGEs but if production exceeds elimination the imbalance leads to disease and this can occur anywhere in the body.
We have been talking about blood glucose but what about fructose? Fructose is handled by the human body in a manner very different from glucose. In overweight and obese humans fructose compared to glucose in equal caloric amounts over a 10 week period causes.
This list represents some but not all of the differences as discussed in many papers including the following.
In addition,
Arguably, the 68 pounds per year of corn syryp that American adults consume (along with the other 68 pounds of added sugar) have contributed significantly to the obesity epidemic in the US.
Dietary sugars: a fat difference.
And along with obesity and diabetes come increased risk of cognitive decline (demetia);
“The incidence of obesity has increased dramatically over the past several years, and in parallel, so has the prevalence of type 2 diabetes (T2D). Numerous studies have demonstrated that both obesity and T2D are associated with lower cognitive performance, cognitive decline, and dementia. Intake of dietary fructose has also increased. In fact, high-fructose corn syrup (HFCS) accounts for as much as 40% of caloric sweeteners used in the United States. Given the increase in the incidence of Alzheimer’s disease (AD), characterized by an age-related decline in memory and cognitive functioning, in this report we review the effects of obesity on cognitive performance and the impact of high fructose intake in promoting cognitive decline. The paper then considers the effects of omega-3 fatty acids (FAs), which have been linked to promising results in cognitive function including ameliorating the impact of a high-fructose diet.”
The emerging role of dietary fructose in obesity and … [Nutr J. 2013] – PubMed – NCBI
The relationship between dietary sugar, refined carbohydrates and obesity are explored in great detail in Good Calories, Bad Calories by Gary Taubes. Taubes presents convincing and consistent data that supports the thesis that dietary sugar and refined carbohydrates contribute significantly to our obesity epidemic and that fat consumption from whole foods including animal fat do not cause obesity or cardiovascular disease. The simple logic is that sugar and refined carbohydrates increase insulin levels which in turn causes storage of carbohydrate as fat and impairs the utilization of fat for energy. While many criticize Taubes thesis for being to simple, the physiologic effects of insulin on fat storage and energy utilization are not disputed.
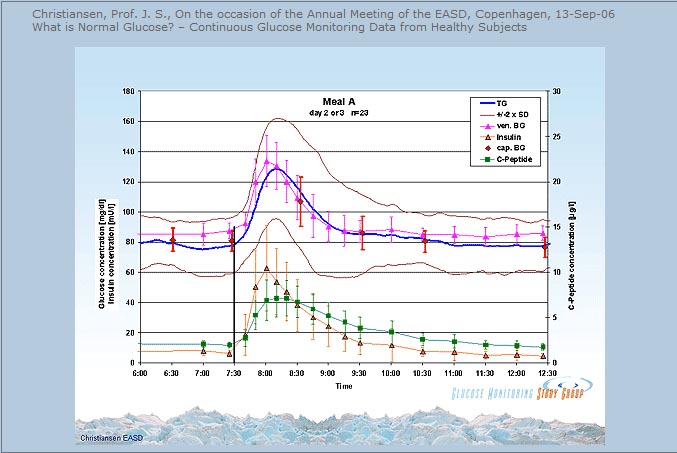
The issue of blood sugar levels and glycosylation appears to be one of level and duration of exposure. If we plot blood sugar over time and draw a graph, the area under the curve of the graph represents total exposure to levels of blood sugar. If we draw a straight horizontal line under this curve that represents a toxic threshold (levels that result in glycosylation that exceed our ability to eliminate AGEs) then the area of toxicity is equal to the area above the threshold line and below the curve of blood sugar. In theory then we should live a lifestyle (nutrition, sleep, exercise, stress reduction) that results in keeping our blood sugars as close as possible to the threshold of toxicity. The Whitehall study suggests that line would be drawn at 86 mg/dl. this discussion provides a conceptual framework. There is no proof of this argument, just data that support the concept that as blood sugars stay elevated above a certain level, this elevation increases the risk of disease. When we examine this argument in the light of evolutionary medicine/health it makes sense. Before the onset of agriculture we did not consume added sweeteners, refined carbohydrates, refined “vegetable” oils (oils from seeds, grains and legumes), nor did we consume manufactured trans fats. So draw a horizontal line in the graph below at some level, make it 86 mg/dl, and look at the area between the blood sugar level and that horizontal line. That is the theoretical toxicity zone.
The association between “normal blood sugar levels” and risk of heart attack and stroke have been observed for a long time but this association has received much less attention than the concern over consumption of fat and cholesterol in the diet. In previous posts I have pointed out the evidence that contradicts the notion that consumption of saturated fat and cholesterol is a problem. Instead, there is growing evidence that easily oxidized polyunsaturated fat (vegetable oil) contributes to atherosclerosis , cardiovascular disease and chronic inflammation. Likewise, there is growing evidence that consumption of sweetened foods and beverages, as well as refined flour foods (which increase blood sugars much more than whole foods) are wreaking havoc in many ways.
So if there is a link between dietary sugar/refined carbohydrate consumption, blood sugar levels and disease, mediated by inflammation and glycosylation, what can we do about it? If there is a link between excessive consumption of pro-inflammatory and easily oxidized refined vegetable oils (linoleic acid) what can we do about it?
Resistance training twice per week for just 20-30 minutes will increase muscle mass and insulin sensitivity, lower blood sugars, preserve bone density, and provide many health benefits.
Eating most carbs at dinner improved weight loss, lowered hunger, reduced abdominal circumference and enhanced body fat mass reductions in a calorie restricted weight loss study of obese adults.
Greater weight loss and hormonal cha… [Obesity (Silver Spring). 2011] – PubMed – NCBI
Sleep deprivation impairs insulin sensitivity, increases the risk of diabetes, hypertension, cardiovascular disease, depression, accidents and cancer, impairs immune function and wound healing, and impairs weight loss on a calorie restricted diet.
Meta-Analysis of Short Sleep Duration and Obesity in Children and Adults
Sleep duration and body mass index in twins: a gene-en… [Sleep. 2012] – PubMed – NCBI
Impact of insufficient sleep on total daily energy expenditure, food intake, and weight gain.
Neurobiological consequences of sleep deprivation.
Sleep and type 2 diabetes mellitus- clinical implications.
The influence of shift work on cognitive functions and oxidative stress.
The impact of sleep deprivation on food desire in the human brain.
Walking 15 minutes after every meal in adults 60 years and older significantly improved 24 hour blood glucose control relative to control subjects who did not walk and was significantly more effective than 45 minutes of sustained morning or afternoon walking in lowering 3 hour post-dinner glucose levels.
Food, sleep, exercise and stress are the primary determinants of health.
While this post discussed two of three proposed mechanisms linking blood sugar levels to disease (modified LDL and AGEs) I did not discuss inflammation. The relationship between dietary sugar, refined carbohydrates and inflammation will be discussed in future posts.
In the meantime, stay tuned for “an egg a day keeps the doctor away”.
Peace,
Bob Hansen MD
