Earlier this year I gave 2 presentations on this topic at the (virtual) annual meeting of Physicians and Ancestral Health, a physician organization dedicated to incorporating evolutionary biology and lifestyle recommendations into the practice of medicine. Here is the first slide:
And here are some very important references:
Please note that this lecture was given before the delta variant arrived so the data applies to the pre-delta period.
MI= Myocardial Infarction (heart attack with loss of muscle), PE=Pulmonary Embolus, DVT= Blood Clots in legs, SIRS= Systemic Inflammatory Response Syndrome
I will skip several of the slides and get to the nutritional immunology and other lifestyle factors.
This slide shows many lifestyle factors that interact with the immune system. The “12% metabolic health” refers to a study demonstrating that only 12% of American adults are metabolically healthy, which will be explained later. Dysbiosis refers to an imbalance in gut bacteria favoring inflammation and immune compromise. The rest should be self explanatory but discussed in detail later in this series.
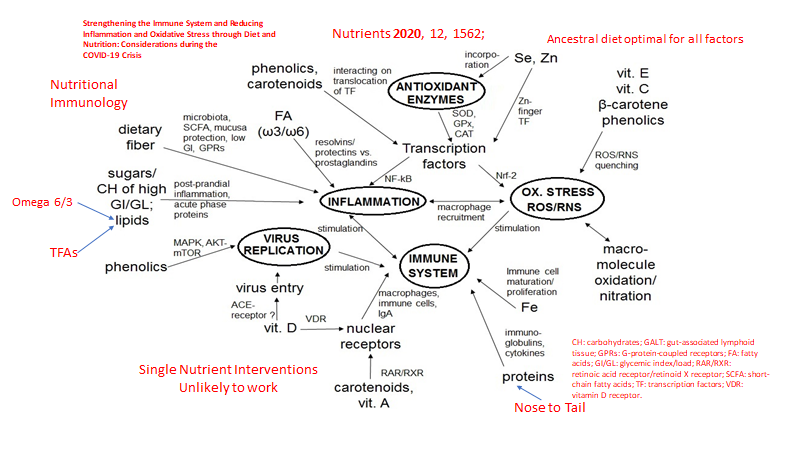
Here is the very busy slide that summarizes nutritional immunology:
w3/w6 refers to the omega 3 to omega 6 ratio in the diet, ROS= Reactive oxygen species (oxidative stress), CH: carbohydrates; GALT: gut-associated lymphoid tissue; GPRs: G-protein-coupled receptors; FA: fatty acids; GI/GL: glycemic index/load; RAR/RXR: retinoic acid receptor/retinoid X receptor; SCFA: short-chain fatty acids; TF: transcription factors; VDR: vitamin D receptor.
Key points in this slide:
Omega 3 fats from fatty fish fight inflammation, excess omega 6 fats from refined “vegetable oils” (corn, soy, cotton seed, sunflower seed, safflower, etc.) contribute to inflammation and blood clots, contributing to cytokine storm and bradykinin storm.
Vitamin D interferes with the virus at multiple points.
Adequate iron (Fe) from meat and seafood is essential for immune function (Iron from plant sources is much less bioavailable compared to meat and seafood.)
Adequate complete protein (not available from vegan diets) is essential for immune function.
Zinc and selenium (both found in seafood and meat) are essential for multiple protective pathways in the immune system (enhancing response to infection and mitigating excessive inflammatory response as cofactors for antioxidant enzymes)
Sugar and high glycemic foods cause inflammation, high blood sugars suppress the immune system
Dietary fiber supports a healthy gut microbiome which in turn suppresses inflammation and provides the gut lining with SFAs (gut epithelium requires SFAs for energy and function, gut barrier function needs SFAs)
Phenolic compounds in colorful vegetables and berries modulate multiple essential immune pathways that can inhibit viral replication.
Carotenoids, phenolics support several vital immune pathways.
Omega 3 fats are the building blocks of chemicals that help resolve inflammation and mitigate against cytokine storm and bradykinin storm.
Multiple vitamins and phenolics support our internal anti-oxidant system.
To get a balanced protein intake we should eat “nose to tail”. Include connective tissue (home made bone broth is a great source) and organ meats (from grass fed/finished ruminants) in addition to muscle meat.
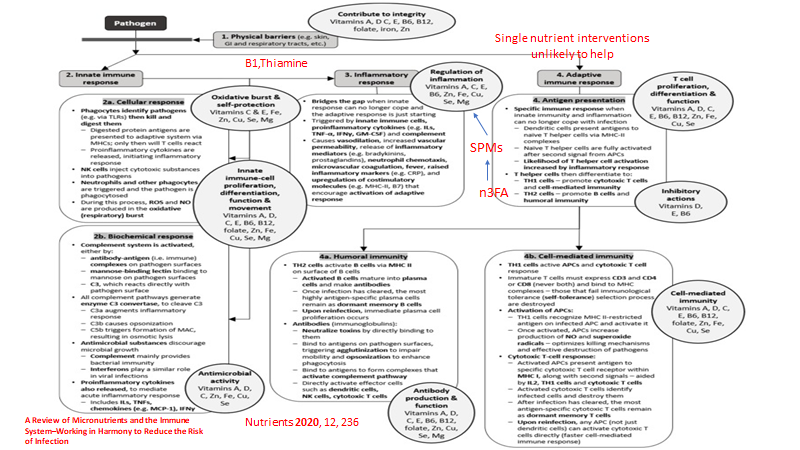
Here is another busy slide that presents more detail, note the reference at the bottom of the slide to read more.
Sorry for the small print but you can see the blow up on line by going here.
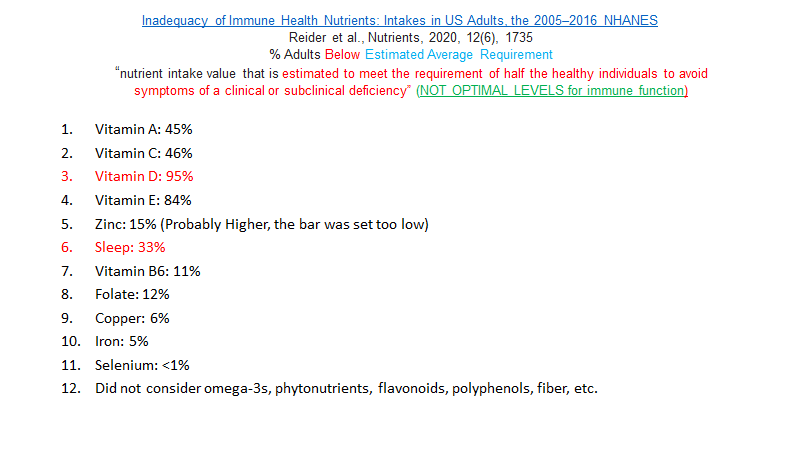
So does the “Standard American Diet” meet these nutritional needs to support a healthy immune system?
The % above represent the % of American adults with intakes BELOW the EAR (Estimated Average Requirement) for various vitamins and minerals. But note the definition of EAR:
“nutrient intake value that is estimated to meet the requirement of half the healthy individuals to avoid symptoms of a clinical or subclinical deficiency” (NOT OPTIMAL LEVELS for immune function)
Note also that this study did not consider omega-3s, phytonutrients, flavonoids, polyphenols, fiber, etc., all of which are essential to a robust immune response to any virus including SARS CoV-2.
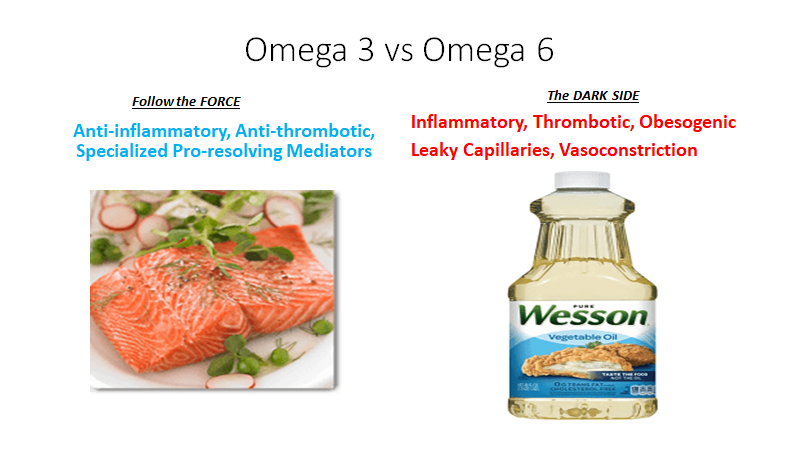
With regards to omega 3 vs omega 6 fats:
Omega 3 fats (EPA and DHA) found in seafood fights inflammation, blood clots. DHA and EPA are the building blocks of SPMs which help RESOLVE INFLAMMATION (MITIGATE CYTOKINE STORM)
We will return to this topic in my next post. We are just scratching the surface of a complex system.
In the context of the COVID 19 pandemic I will close with the usual summary.
Exercise, especially out of doors in a green space, supports the immune system
Get some sunshine and make sure you have adequate Vitamin D levels. Supplement with Vitamin D3 to get your levels above 30 ng/ml. (read this Open Letter)
Eliminate sugar-added foods and beverages from your diet. These increase inflammation, cause metabolic dysfunction, and suppress immunity.
Eliminate refined-inflammatory “vegetable oils” from your diet, instead eat healthy fat.
Clean up your home environment and minimize your family’s exposure to environmental toxins by following recommendations at EWG.org with regards to household products, personal care products, and organic foods. (https://www.ewg.org/)
If you are over age 12 and eligible for vaccination, consider protecting yourself and your neighbor with vaccination.
THIS WEBSITE PROVIDES INFORMATION FOR EDUCATIONAL PURPOSES ONLY. CONSULT YOUR HEALTH CARE PROVIDER FOR MEDICAL ADVICE.
Eat clean, drink filtered water, love, laugh, exercise outdoors in a greenspace, get some morning sunlight, block the blue light before bed, engage in meaningful work, find a sense of purpose, spend time with those you love, AND sleep well tonight.
First the good news, preliminary data on two vaccines (from Pfizer and Moderna) show 95% efficacy. Today Pfizer applied to the FDA for EUA (Emergency Use Authorization) for their mRNA VACCINE. Both vaccines use an approach never used before. The vaccines both involve injecting messenger RNA (mRNA) which enters human cells where the cell machinery produces a sequence of amino acids which reside on the spike protein of the SARS-COV-2 virus. The immune system then responds to that portion or the virus protein. Both vaccines reduced the rate of moderate to severe illness by about 95% compared to the placebo group. No study subjects were younger than 18. We do not yet know the age distribution or underlying medical condition profile of the vaccine and placebo recipients.
Data are being released to the medical community for review. Hopefully there will be a broad representation of our population in the study groups.
If approved for Emergency Use Pfizer estimates that about 40 million doses could be produced by year’s end. That would cover 20 million people (each person receives a series of two shots).
Cautions:
So far safety looks good, but rare complications will not be known for a long time.
Safety and efficacy in folks younger than 18 not known.
The Pfizer vaccine requires very cold storage which is not available in pharmacies, doctor’s offices and clinics. Distribution logistics will be complicated and will require storage in hospitals or other facilities that have minus 70 degree F capability.
We do not know if the vaccine reduces death rate with infection, that will not be known for at least a year or two.
We do not know how long immunity will last.
It will take more than a year to ramp up production and administer the vaccine to adequate numbers of people to achieve herd immunity.
Even after large numbers of people are vaccinated, masks, social distancing and hand washing will remain important parts of protecting the public.
If availability of a vaccine causes people to be less adherent to behavioral guidelines, the net effect could be greater illness and death rather than less protection.
You can listen to an interview with vaccine specialist Dr. Paul Offit here:
The interview describes how the vaccine trials were designed and discusses the independent groups of scientists and doctors who review data on vaccines. The important roles of the DSMB (Data Safety Monitoring Board) and ACIP (Advisory Committee on Immunization Practices) are discussed. Many areas are covered. They include problems with previous vaccines, realistic expectations about production and distribution, the many kinds of vaccines still under various stages of study, the process of EUA and the differences between EUA and FDA final approval.
There’s a DSMB for each of these phase 3 trials, which is a multidisciplinary group, including people who are experienced with clinical trials, biostatisticians, bioethicists, immunologists, vaccinologists, and virologists. You have this big crew, they’re reviewing the blinded data, and they have a pre-programmed time of review. Also, they have stopping rules that are defined ahead of time for both futility and for overwhelming efficacy.
Drugs for Covid:
Dexamethasone, an anti-inflammatory steroid, has been demonstrated to reduce death rates in very sick patients.
The study, published in The New England Journal of Medicine in July, found the drug cut mortality by a third among severely ill COVID-19 patients who were on ventilators, and by a fifth for patients receiving supplemental oxygen. It was found not to have any benefits for patients with mild illness, and there was some evidence of potential harm.
So far, no other drugs have been shown to reduce risk of death. Remdesivir at best reduces duration of illness.
But today a combination drug (Baricitinib plus Remdesivir), was granted an EUA by the FDA. Like Remdesivir, the combination reduced length of illness. In the case of the combination, the duration of illness was reduced by only ONE DAY which is less than the reduction previously reported with Remdesivir alone (3 days). This discrepancy has not been explained and it concerns me. Why would an effective drug combination produce less reduction in duration of illness than one of the drugs used alone? Hmmmmmmmmmmmm
But more importantly:
“The odds of a patient dying or being ventilated at day 29 was lower in the combination group compared with those taking placebo + remdesivir, the press release said without providing specific data. For all of these endpoints, the effects were statistically significant.”
Data on the actual reduction in risk of death has not yet been released for scientific review.
Remember EUA was previously granted for Hydroxychloroquine, then revoked when larger controlled studies showed no benefit and possible harm. Likewise, use of convalescent plasma from recovered COVID patients was granted EUA but the data so far do not support its use.
So we have very hopeful preliminary data on 2 vaccines and we have dexamethasone and a new combination drug reported to reduce mortality in very sick patients. The data on dexamethasone is convincing. All we have on the combination treatment is a press release so far.
Now the bad news.
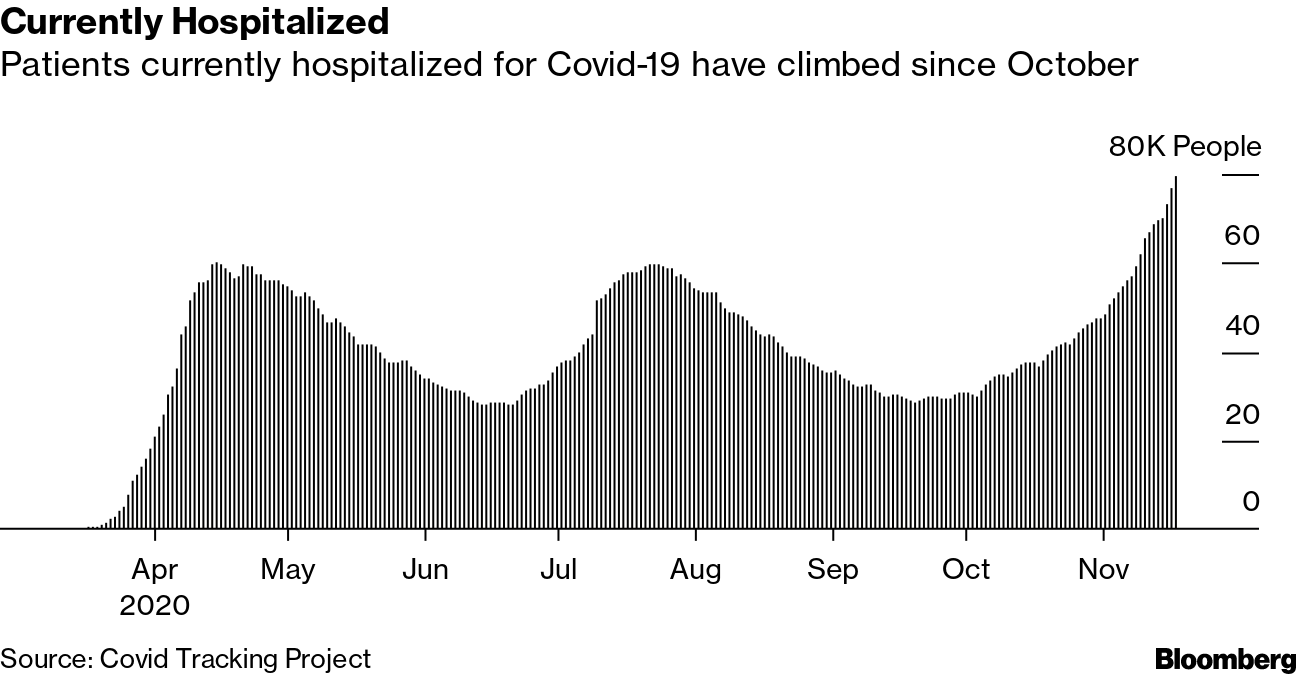
Hospitalization rates and infection rates are at record highs.
One out of five hospitals this week in the US anticipate a critical staffing shortage of health care workers within a week.
Last week I heard an interview with an ICU doctor in Billings Montana. The ICU COVID-19 cases were so great in number that in order to meet the demand the hospital did the following:
Converted single bed ICU rooms to doubles
Converted the cardiac care unit to a COVID ICU
Converted recovery room beds to ICU beds
Converted ER beds to ICU beds.
All of those ICU beds were full. The doctor said if the growth in cases did not slow down they would be left with “difficult choices”. Read that as triage. Patients most likely to survive get critical care, those less likely get comfort measures. Meanwhile non-COVID patients who need critical care may not get the level of service they need.
Doctors and nurses across the country are suffering burnout. Many have become infected. Some have died. The American Nurses Association report over 1200 nurses have died from COVID-19 in the US.
In a survey of hospital nurses conducted last week 80% reported inadequate PPE.
Interviews with nurses reveal that some patients dying of COVID do not believe they have the disease. There is a cult of Trump followers who believe his dangerous lies, misinformation and conspiracy theories. Despite death staring them in the face, some still refuse to believe the virus is real. Amazing.
So it will get worse before it gets better.
Next post will discuss “Long Covid”.
In the context of the COVID 19 pandemic I will close with the usual summary.
Eliminate sugar-added foods and beverages from your diet. These increase inflammation, cause metabolic dysfunction, and suppress immunity.
Eliminate refined-inflammatory “vegetable oils” from your diet, instead eat healthy fat.
Clean up your home environment and minimize your family’s exposure to environmental toxins by following recommendations at EWG.org with regards to household products, personal care products, and organic foods. (https://www.ewg.org/)
THIS WEBSITE PROVIDES INFORMATION FOR EDUCATIONAL PURPOSES ONLY. CONSULT YOUR HEALTH CARE PROVIDER FOR MEDICAL ADVICE.
Eat clean, drink filtered water, love, laugh, exercise outdoors in a greenspace, get some morning sunlight, block the blue light before bed, engage in meaningful work, find a sense of purpose, spend time with those you love, AND sleep well tonight.
I have previously posted an analysis of the IFR (infection fatality rate) of COVID 19 vs influenza.
Here it is again, an excerpt from my previous post:
The infection fatality rate (IFR) for COVID-19 IS 25 times greater than the H1N1 FLU pandemic of 2009.
An analysis comparing the 2009 H1N1 influenza A pandemic to COVID 19 suggests this:
Case Fatality Rate
Infection Fatality Rate
2009 H1N1 Virus (flu)
0.1% to 0.2%
0.02%
COVID-19 New York
8%
0.50%
CFR is # deaths/#cases identified by nasal PCR, IFR is # deaths/actual # cases in a given population, estimated by antibody testing of a large population
But since that post, more data has become available suggesting that the IFR for COVID 19 may be 50 to 100 times greater than the aggregate of multiple flu viruses experienced during the past several years.
You can find an informative discussion about this data here.
A common problem has been that various bloggers, social media discussions, and news reports have compared the CFR of previous flu pandemics with the IFR of COVID 19. In fact the CDC website presents a fatality rate for the “flu” to be in the range of 0.1 to 0.2 %, and this number is widely quoted. But if you dig a little deeper you will learn that this is the CFR for the flu, not the IFR. Yet it has been directly compared to the IFR for COVID 19, which is very misleading.
What is the most recent data on COVID 19?
First a quote from the study:
Conclusion Based on a systematic review and meta-analysis of published evidence on COVID-19 until May, 2020, the IFR of the disease across populations is 0.68% (0.53-0.82%). However, due to very high heterogeneity in the meta-analysis, it is difficult to know if this represents the true point estimate. It is likely that, due to age and perhaps underlying comorbidities in the population, different places will experience different IFRs due to the disease. Given issues with mortality recording, it is also likely that this represents an underestimate of the true IFR figure.
And here is a graphic from the study showing the range of IFR in various populations:
I will follow this up to make sure it is published after peer review but so far the data looks reliable.
So a more thorough and updated look at COVID 19 infection fatality rate utilizing a larger data base suggests an IFR higher than the one I originally reported, based upon a NY study. (0.65% vs 0.5%, but the same ballpark)
Now for the data on the IFR for “the flu”.
Here is the link to CDC data on the flu for various years.
But when you explore this data please keep in mind the difference between CFR and IFR. Because asymptomatic + subclinical flu infections can be > 50% depending on the year, when you adjust the CFR for the greater denominator (to include asymptomatic and subclinical infections) to calculate an IFR for the flu you will understand the dramatic difference, consistent with the 2009 H1N1 South Korea data presented in the table above.
Influenza infection manifests in a wide spectrum of severity, including symptomless pathogen carriers. We conducted a systematic review and meta-analysis of 55 studies to elucidate the proportional representation of these asymptomatic infected persons. We observed extensive heterogeneity among these studies. The prevalence of asymptomatic carriage (total absence of symptoms) ranged from 5.2% to 35.5% and subclinical cases (illness that did not meet the criteria for acute respiratory or influenza-like illness) from 25.4% to 61.8%. Statistical analysis showed that the heterogeneity could not be explained by the type of influenza, the laboratory tests used to detect the virus, the year of the study, or the location of the study. Projections of infection spread and strategies for disease control require that we identify the proportional representation of these insidious spreaders early on in the emergence of new influenza subtypes or strains and track how this rate evolves over time and space.
Calculate the average of asymptomatic and subclinical flu cases. They average 15.3% and 48.6% respectively. (5.2% plus 35.5% divided by 2, 25.4% plus 61.8% divided by 2 respectively). Add the two and you get an average of 63.95% of the US population being asymptomatic or subclinical cases of the flu in any given year. Yes that is high, and yes it is the best data available.
Now take a more conservative 50 % as applied in my calculation below. But first the CDC website.
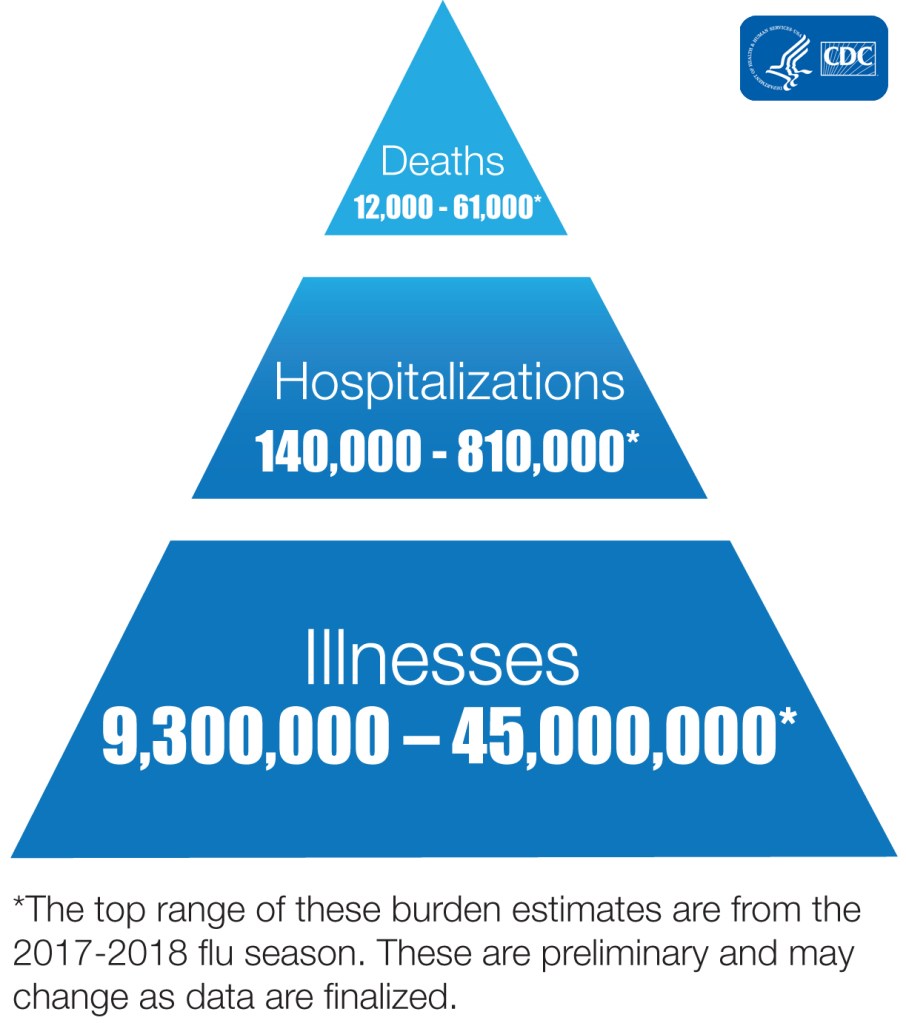
If you go to the CDC website you will see a table that shows data for “symptomatic illnesses” with hospitalizations and deaths. Which means the fatality rates are CFRs not IFRs. The CFR for multiple flu seasons averages out to about 0.1%. Here is the chart.
* Estimates from the 2017-2018 and 2018-2019 seasons are preliminary and may change as data are finalized.
And here is another graphic.
“Illnesses” above include only symptomatic cases, that number does not include the much greater subclinical and completely asymptomatic cases.
Looking at the table and graphics above remember that the population of the US is 331 million. If 50% of the population has subclinical or asymptomatic flu infection that means the denominator would be 165 million plus the number of symptomatic cases. Run the math for the lowest and highest symptomatic infection years. You get an IFR range of 0.0069% to 0.0290% for the flu. The higher of these two is very close to the number in my chart above from my earlier post. Here it is again.
Case Fatality Rate
Infection Fatality Rate
2009 H1N1 Virus (flu)
0.1% to 0.2%
0.02%
COVID-19 New York
8%
0.50%
CFR is # deaths/#cases identified by nasal PCR, IFR is # deaths/actual # cases in a given population, estimated by antibody testing of a large population
So the data are consistent over time.
So next time someone quotes a fatality rate of 0.1% for the flu, remember that this is the CFR (based upon symptomatic illness) not the IFR (based upon the true population prevalence which would include all infections, with symptoms, without symptoms, and subclinical infections). The CDC denominator (# cases) includes only “symptomatic illness.”
If these numbers do not convince those who claim no difference between “the flu” and COVID 19, they should also consider the following observations.
No influenza pandemic in the past several decades has ever overwhelmed the NYC hospital system and the NYC morgues as the COVID 19 pandemic has.
No influenza pandemic has required 200 refrigerated trucks sitting outside of hospitals, each filled with 100 chilled corpses per truck in a single city, with all morgues filled, on the verge of bulldozing mass graves (yes, that is what happened in NYC). NYC did not shelter in place as early as Seattle and San Francisco, NYC delayed about 11 days compared with the later two. Of course NYC has a subway system which made things worse but here is the point: never happened before with any flu in NYC.
No influenza pandemic has required a national guard unit specifically trained to handle mass casualties (dead bodies) which has been the case in NYC. Members of that national guard unit reported that they had never experienced a war zone or natural disaster that compared with COVID 19 in NYC. Remember this unit responded to hurricane Katrina and many war zones. Their sole job is to handle dead bodies. Their members experienced high rates of PTSD in NYC as did doctors and nurses in ERs and ICUs.
These events have not occurred with any previous flu pandemic. They occurred with COVID 19. Why the difference? If COVID 19 is just another flu, why have these events not occurred with previous flu seasons?
One must also consider the large number of disabled (cardiac and respiratory cripples) survivors of COVID-19, being reported on an increasing basis. These are not included in fatality rates, but represent an additional burden of COVID-19 compared to the survivors of influenza infections who have faired much better historically.
And finally consider a recent study comparing the 2019 H1N1 (“Spanish flu”) to COVID 19. The Spanish flu killed 50 million worldwide (some estimates higher). This study compared all-cause deaths in both pandemics.
Eliminate sugar-added foods and beverages from your diet. These increase inflammation, cause metabolic dysfunction, and suppress immunity.
Eliminate refined-inflammatory “vegetable oils” from your diet, instead eat healthy fat.
Clean up your home environment and minimize your family’s exposure to environmental toxins by following recommendations at EWG.org with regards to household products, personal care products, and organic foods. (https://www.ewg.org/)
THIS WEBSITE PROVIDES INFORMATION FOR EDUCATIONAL PURPOSES ONLY. CONSULT YOUR HEALTH CARE PROVIDER FOR MEDICAL ADVICE.
Eat clean, drink filtered water, love, laugh, exercise outdoors in a greenspace, get some morning sunlight, block the blue light before bed, engage in meaningful work, find a sense of purpose, spend time with those you love, AND sleep well tonight.