I have previously posted an analysis of the IFR (infection fatality rate) of COVID 19 vs influenza.
Here it is again, an excerpt from my previous post:
The infection fatality rate (IFR) for COVID-19 IS 25 times greater than the H1N1 FLU pandemic of 2009.
An analysis comparing the 2009 H1N1 influenza A pandemic to COVID 19 suggests this:
| Case Fatality Rate | Infection Fatality Rate | |
| 2009 H1N1 Virus (flu) | 0.1% to 0.2% | 0.02% |
| COVID-19 New York | 8% | 0.50% |
References and more discussion can be found here.
But since that post, more data has become available suggesting that the IFR for COVID 19 may be 50 to 100 times greater than the aggregate of multiple flu viruses experienced during the past several years.
You can find an informative discussion about this data here.
https://medium.com/@gidmk/covid-19-is-far-more-lethal-than-influenza-69b6628e69f2
A common problem has been that various bloggers, social media discussions, and news reports have compared the CFR of previous flu pandemics with the IFR of COVID 19. In fact the CDC website presents a fatality rate for the “flu” to be in the range of 0.1 to 0.2 %, and this number is widely quoted. But if you dig a little deeper you will learn that this is the CFR for the flu, not the IFR. Yet it has been directly compared to the IFR for COVID 19, which is very misleading.
What is the most recent data on COVID 19?
First a quote from the study:
Conclusion Based on a systematic review and meta-analysis of published evidence on COVID-19 until May, 2020, the IFR of the disease across populations is 0.68% (0.53-0.82%). However, due to very high heterogeneity in the meta-analysis, it is difficult to know if this represents the true point estimate. It is likely that, due to age and perhaps underlying comorbidities in the population, different places will experience different IFRs due to the disease. Given issues with mortality recording, it is also likely that this represents an underestimate of the true IFR figure.
And here is a graphic from the study showing the range of IFR in various populations:

Here is a link to the study:
Note that this is a preprint with the following caveat: This article is a preprint and has not been peer-reviewed [what does this mean?]. It reports new medical research that has yet to be evaluated and so should not be used to guide clinical practice.
I will follow this up to make sure it is published after peer review but so far the data looks reliable.
So a more thorough and updated look at COVID 19 infection fatality rate utilizing a larger data base suggests an IFR higher than the one I originally reported, based upon a NY study. (0.65% vs 0.5%, but the same ballpark)
Now for the data on the IFR for “the flu”.
Here is the link to CDC data on the flu for various years.
https://www.cdc.gov/flu/about/burden/index.html
But when you explore this data please keep in mind the difference between CFR and IFR. Because asymptomatic + subclinical flu infections can be > 50% depending on the year, when you adjust the CFR for the greater denominator (to include asymptomatic and subclinical infections) to calculate an IFR for the flu you will understand the dramatic difference, consistent with the 2009 H1N1 South Korea data presented in the table above.
http://Heterogeneous and Dynamic Prevalence of Asymptomatic Influenza Virus Infections
Abstract
Influenza infection manifests in a wide spectrum of severity, including symptomless pathogen carriers. We conducted a systematic review and meta-analysis of 55 studies to elucidate the proportional representation of these asymptomatic infected persons. We observed extensive heterogeneity among these studies. The prevalence of asymptomatic carriage (total absence of symptoms) ranged from 5.2% to 35.5% and subclinical cases (illness that did not meet the criteria for acute respiratory or influenza-like illness) from 25.4% to 61.8%. Statistical analysis showed that the heterogeneity could not be explained by the type of influenza, the laboratory tests used to detect the virus, the year of the study, or the location of the study. Projections of infection spread and strategies for disease control require that we identify the proportional representation of these insidious spreaders early on in the emergence of new influenza subtypes or strains and track how this rate evolves over time and space.
Calculate the average of asymptomatic and subclinical flu cases. They average 15.3% and 48.6% respectively. (5.2% plus 35.5% divided by 2, 25.4% plus 61.8% divided by 2 respectively). Add the two and you get an average of 63.95% of the US population being asymptomatic or subclinical cases of the flu in any given year. Yes that is high, and yes it is the best data available.
Now take a more conservative 50 % as applied in my calculation below. But first the CDC website.
If you go to the CDC website you will see a table that shows data for “symptomatic illnesses” with hospitalizations and deaths. Which means the fatality rates are CFRs not IFRs. The CFR for multiple flu seasons averages out to about 0.1%. Here is the chart.
| Symptomatic Illnesses | Medical Visits | Hospitalizations | Deaths | |||||
|---|---|---|---|---|---|---|---|---|
| Season | Estimate | 95% U I | Estimate | 95% U I | Estimate | 95% U I | Estimate | 95% U I |
| 2010-2011 | 21,000,000 | (20,000,000 – 25,000,000) | 10,000,000 | (9,300,000 – 12,000,000) | 290,000 | (270,000 – 350,000) | 37,000 | (32,000 – 51,000) |
| 2011-2012 | 9,300,000 | (8,700,000 – 12,000,000) | 4,300,000 | (4,000,000 – 5,600,000) | 140,000 | (130,000 – 190,000) | 12,000 | (11,000 – 23,000) |
| 2012-2013 | 34,000,000 | (32,000,000 – 38,000,000) | 16,000,000 | (15,000,000 – 18,000,000) | 570,000 | (530,000 – 680,000) | 43,000 | (37,000 – 57,000) |
| 2013-2014 | 30,000,000 | (28,000,000 – 33,000,000) | 13,000,000 | (12,000,000 – 15,000,000) | 350,000 | (320,000 – 390,000) | 38,000 | (33,000 – 50,000) |
| 2014-2015 | 30,000,000 | (29,000,000 – 33,000,000) | 14,000,000 | (13,000,000 – 16,000,000) | 590,000 | (540,000 – 680,000) | 51,000 | (44,000 – 64,000) |
| 2015-2016 | 24,000,000 | (20,000,000 – 33,000,000) | 11,000,000 | (9,000,000 – 15,000,000) | 280,000 | (220,000 – 480,000) | 23,000 | (17,000 – 35,000) |
| 2016-2017 | 29,000,000 | (25,000,000 – 45,000,000) | 14,000,000 | (11,000,000 – 23,000,000) | 500,000 | (380,000 – 860,000) | 38,000 | (29,000 – 61,000) |
| Preliminary estimates* | Estimate | 95% UI | Estimate | 95% UI | Estimate | 95% UI | Estimate | 95% UI |
| 2017-2018* | 45,000,000 | (39,000,000 – 58,000,000) | 21,000,000 | (18,000,000 – 27,000,000) | 810,000 | (620,000 – 1,400,000) | 61,000 | (46,000 – 95,000) |
| 2018-2019* | 35,520,883 | (31,323,881 – 44,995,691) | 16,520,350 | (14,322,767 – 21,203,231) | 490,561 | (387,283 – 766,472) | 34,157 | (26,339 – 52,664) |
* Estimates from the 2017-2018 and 2018-2019 seasons are preliminary and may change as data are finalized.
And here is another graphic.
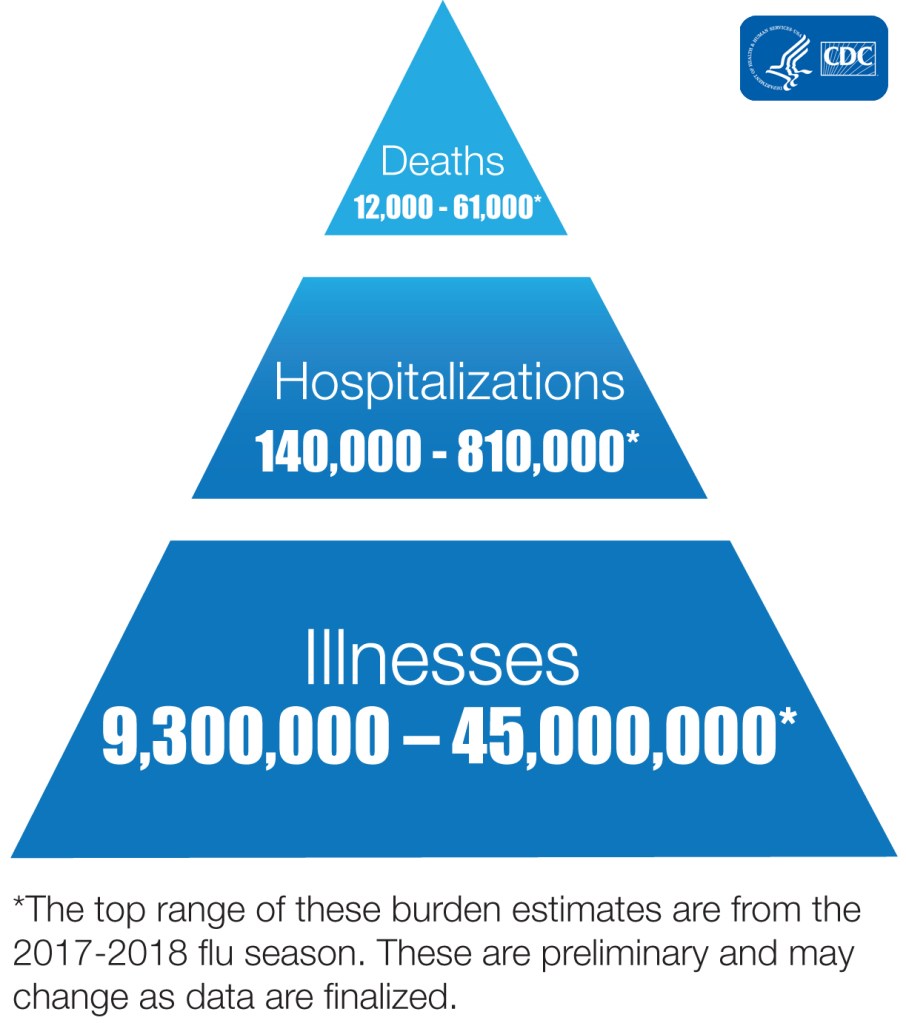
“Illnesses” above include only symptomatic cases, that number does not include the much greater subclinical and completely asymptomatic cases.
Looking at the table and graphics above remember that the population of the US is 331 million. If 50% of the population has subclinical or asymptomatic flu infection that means the denominator would be 165 million plus the number of symptomatic cases. Run the math for the lowest and highest symptomatic infection years. You get an IFR range of 0.0069% to 0.0290% for the flu. The higher of these two is very close to the number in my chart above from my earlier post. Here it is again.
| Case Fatality Rate | Infection Fatality Rate | |
| 2009 H1N1 Virus (flu) | 0.1% to 0.2% | 0.02% |
| COVID-19 New York | 8% | 0.50% |
So the data are consistent over time.
So next time someone quotes a fatality rate of 0.1% for the flu, remember that this is the CFR (based upon symptomatic illness) not the IFR (based upon the true population prevalence which would include all infections, with symptoms, without symptoms, and subclinical infections). The CDC denominator (# cases) includes only “symptomatic illness.”
If these numbers do not convince those who claim no difference between “the flu” and COVID 19, they should also consider the following observations.
No influenza pandemic in the past several decades has ever overwhelmed the NYC hospital system and the NYC morgues as the COVID 19 pandemic has.
No influenza pandemic has required 200 refrigerated trucks sitting outside of hospitals, each filled with 100 chilled corpses per truck in a single city, with all morgues filled, on the verge of bulldozing mass graves (yes, that is what happened in NYC). NYC did not shelter in place as early as Seattle and San Francisco, NYC delayed about 11 days compared with the later two. Of course NYC has a subway system which made things worse but here is the point: never happened before with any flu in NYC.
No influenza pandemic has required a national guard unit specifically trained to handle mass casualties (dead bodies) which has been the case in NYC. Members of that national guard unit reported that they had never experienced a war zone or natural disaster that compared with COVID 19 in NYC. Remember this unit responded to hurricane Katrina and many war zones. Their sole job is to handle dead bodies. Their members experienced high rates of PTSD in NYC as did doctors and nurses in ERs and ICUs.
These events have not occurred with any previous flu pandemic. They occurred with COVID 19. Why the difference? If COVID 19 is just another flu, why have these events not occurred with previous flu seasons?
One must also consider the large number of disabled (cardiac and respiratory cripples) survivors of COVID-19, being reported on an increasing basis. These are not included in fatality rates, but represent an additional burden of COVID-19 compared to the survivors of influenza infections who have faired much better historically.
And finally consider a recent study comparing the 2019 H1N1 (“Spanish flu”) to COVID 19. The Spanish flu killed 50 million worldwide (some estimates higher). This study compared all-cause deaths in both pandemics.
You can view it here. http://Full text COVID-19 and 1918 Flu Mortality in NYC ‘In the Same Ballpark’

Res Ipsa Loquitur.
In the context of the COVID 19 pandemic I will close with the usual summary.
- Avoid alcohol consumption (alcohol wreaks havoc with your immunity)
- Get plenty of sleep (without adequate sleep your immune system does not work well )
- Follow good sleep habits
- Exercise, especially out of doors in a green space, supports the immune system
- Get some sunshine and make sure you have adequate Vitamin D levels.
- Eat an anti-inflammatory diet rich in micronutrients.
- Practice stress reduction like meditation and yoga which improves the immune system
- Eliminate sugar-added foods and beverages from your diet. These increase inflammation, cause metabolic dysfunction, and suppress immunity.
- Eliminate refined-inflammatory “vegetable oils” from your diet, instead eat healthy fat.
- Clean up your home environment and minimize your family’s exposure to environmental toxins by following recommendations at EWG.org with regards to household products, personal care products, and organic foods. (https://www.ewg.org/)
THIS WEBSITE PROVIDES INFORMATION FOR EDUCATIONAL PURPOSES ONLY. CONSULT YOUR HEALTH CARE PROVIDER FOR MEDICAL ADVICE.
Eat clean, drink filtered water, love, laugh, exercise outdoors in a greenspace, get some morning sunlight, block the blue light before bed, engage in meaningful work, find a sense of purpose, spend time with those you love, AND sleep well tonight.
Doctor Bob
