Sugar affects the pleasure centers of the brain in a manner much the same as cocaine, heroin, and other addictive substances. In that respect Americans are addicted to sugar. The average American consumes 136 pounds of added sugar per year. This includes 68 pounds of high fructose corn syrup (HFCS) and other corn-derived sweetener. These figures do not include the amount of natural sugar found in whole foods. These figures cover only the sugar added to food and beverages to make them sweeter.
From wikipedia:
“Sugar is the generalized name for a class of chemically-related sweet-flavored substances, most of which are used as food. They are carbohydrates, composed of carbon, hydrogen and oxygen. There are various types of sugar derived from different sources. Simple sugars are called monosaccharides and include glucose (also known as dextrose), fructose and galactose. The table or granulated sugar most customarily used as food is sucrose, a disaccharide (in the body, sucrose hydrolyses into fructose and glucose). Other disaccharides include maltose and lactose. Chemically-different substances may also have a sweet taste, but are not classified as sugars. Some are used as lower-calorie food substitutes for sugar described as artificial sweeteners.”
“The most widely used varieties of HFCS are: HFCS 55 (mostly used in soft drinks), approximately 55% fructose and 42% glucose; and HFCS 42 (used in beverages, processed foods, cereals, and baked goods), approximately 42% fructose and 53% glucose”
also from Wikipedia:
“It used to be believed that sugar raised blood glucose levels more quickly than did starch because of its simpler chemical structure. However, it turned out that white bread or French fries have the same effect on blood sugar as pure glucose, while fructose, although a simple carbohydrate, has a minimal effect on blood sugar. As a result, as far as blood sugar is concerned, carbohydrates are classified according to their glycemic index, a system for measuring how quickly a food that is eaten raises blood sugar levels, and glycemic load, which takes into account both the glycemic index and the amount of carbohydrate in the food.[60]”
Our blood sugars (glucose level measured as milligrams per deciliter or mg/dl) rise after every meal or snack and our body responds with the secretion of insulin from the pancreas to enable efficient processing of the sugar. Insulin facilitates the uptake of glucose into cells for utilization as energy and storage as starch (glycogen) or fat. Since glycogen storage capacity in the human body is relatively small (equivalent to two hours of hard labor) and filled quickly, most caloric intake that is not used immediately for work gets stored as fat.
Diabetics have higher blood sugars than “normal” people after an overnight fast as well as after a meal. But the definition of a “normal” fasting blood sugar as compared to a diabetic or “pre-diabetic” level is quite arbitrary. Likewise the definition of a “normal” blood sugar 2 hours after swallowing 75 grams of sugar ( oral glucose tolerance test or OGTT) is also quite arbitrary.
Now the story becomes alarming. Blood sugar levels measured 2 hours after a challenge with 50 or 75 grams of oral sugar intake that are below the diabetic range are associated with a significantly increased risk of heart attack and stroke. Likewise, hemoglobin A1c levels (A1c) below the diabetic range are also associated with increased risk of heart attack. Hemoglobin is the protein in red blood cells that carries and delivers oxygen throughout our bodies. A1c is a measurement of the % hemoglobin that has a molecule of sugar attached to it. A1c is thought to reflect the average amount of blood sugar during the prior 3 months (the average life of a red blood cell is 3 months). A1c is also called glycated hemoglobin.
So let’s discuss some data.
The Whitehall study followed 17,869 male civil servants aged 40-64 in England for 33 years. They measured the blood sugar 2 hours after consumption of 50 grams of glucose at the start of the study and recorded death from all causes, cardiovascular causes, and respiratory causes and cancers during the 33 year period. They found a direct linear relationship between the baseline 2 hour blood sugar measurement and the risk of coronary death over 33 years. The higher the blood sugar two hours after the sugar drink, the greater the risk of death from a cardiac event. This relationship held true for blood sugars starting at 83 mg/dl (considered normal). There was a dose response relationship between 83 mg/dl and 200 mg/dl. The linear relationship was attenuated by 45% after adjustment for baseline coronary heart disease, BMI, systolic blood pressure, blood cholesterol, smoking, physical activity, lung function and employment grade. They also found that glucose intolerance (post-load blood glucose level 96-200 mg/dl) is associated with increased mortality risk from all causes, stroke, and respiratory disease but not all cancers. At the time of this study publication diabetes was defined as a two hour blood sugar response greater than 200 mg/dl, responses between 96 and 200 were labeled glucose intolerance.
They stated:
Our findings are consistent with recent meta-analyses of post-load glucose and CVD mortality that have assembled results from diverse population-based studies of non diabetic subjects and shown the effect of glucose intolerance on risk over median follow-up of 9-12 years.
Relation between blood glucose and coronary mortality over 33 years in theWhitehall Study.
A study in 2009 showed that patients who did not meet the ADA definition of diabetes (2 hour blood sugar > 140 mg/dl using 75 gm of glucose) but had elevated one hour glucose tolerance test (> 155 mg/dl) had “sub clinical inflammation, high lipid ratios and insulin resistance.” These translate into increased cardiovascular risk.
Inflammation markers and metabolic characteristics of subjects with one-hour plasma glucose levels
Hemoglobin A1c is a measurement of the amount of sugar attached to the hemoglobin protein in the red blood cells that carry oxygen in the blood. It is thought to reflect an average blood sugar level during the previous 2-3 months. A1c > 6.5% is considered diagnostic for diabetes. But cardiovascular risk increases at A1c levels well below the level associated with diabetes. In one non-diabetic adults with A1c below 5% had the lowest rates of cardiovascular disease. Cardiovascular disease and death increased by 24 % for every 1% rise above A1c of 5% in non-diabetics.
In another study heart disease risk increased as A1c rose above 4.6%, a level that corresponds to an average blood sugar level of 86 mg/dl, remarkably close to the threshold of 83 mg/dl found in the Whitehall study.
“In non diabetic adults, HbA1c level was not related to CHD risk below a level of 4.6% but was significantly related to risk above that level (P<.001). In diabetic adults, the risk of CHD increased throughout the range of HbA1c levels. In the adjusted model, the Risk Ratio of CHD for a 1 percentage point increase in HbA1c level was 2.36 (95% CI, 1.43-3.90) in persons without diabetes but with an HbA1c level greater than 4.6%. In diabetic adults, the Risk Ratio was 1.14 (95% CI, 1.07-1.21) per 1 percentage point increase in HbA1c across the full range of HbA1c values.”
In other words, A1c level of 5.6% vs 4.6% was associated with more than doubling the risk of CHD. That is a profound difference. (Statin drugs reduced risk of cardiac mortality by 13% in studies that mixed primary and secondary prophylaxis populations)
In a study that followed 11,092 adults without diabetes or cardiovascular disease for 15 years the associations between A1c at baseline and the development of diabetes, coronary artery disease and stroke were evaluated.
Multivariate-Adjusted Hazard Ratio
A1c at baseline coronary disease risk diabetes risk stroke risk
<5% 0.96 (0.74-1.24) 0.52 (0.40 to 0.69) 1.09 (0.67-1.76)
5% to < 5.5%: 1.00 (reference) 1.00 (reference) 1.00
5.5% to < 6%: 1.23 (1.07-1.41) 1.86 (1.67 to 2.08) 1.23 (1.07-1.41)
6% to < 6.5%: 1.78 (1.48-2.15) 4.48 (3.92 to 5.13) 1.78 (1.48-2.15)
>= 6.5%: 1.95 (1.53-2.48) 16.47 (14.22-19.08) 1.95 (1.53-2.48)
So below the range for diabetes, A1c levels in the range of 6 to <6.5% are associated with an increased the risk of heart disease and stroke by 78% an astounding amount in comparison to the purported effects of blood cholesterol. But this study had another interesting result.
“The association between the fasting glucose levels and the risk of cardiovascular disease or death from any cause was not significant in models with adjustment for all co-variates as well as glycated hemoglobin. For coronary heart disease, measures of risk discrimination showed significant improvement when glycated hemoglobin was added to models including fasting glucose.”
In other words, when A1c was included in a mathematical model of multiple risk factors the effect of fasting glucose on risk of cardiovascular disease disappeared. There are theoretical reasons to explain this but that is the topic of another post.
The authors summarized by saying.
“In this community-based population of non diabetic adults, glycated hemoglobin was similarly associated with a risk of diabetes and more strongly associated with risks of cardiovascular disease and death from any cause as compared with fasting glucose.”
Glycated Hemoglobin, Diabetes, and Cardiovascular Risk in Nondiabetic Adults.
Now some folks are concerned that the 2 hour blood sugar response to swallowing 75 grams of sugar does not reflect the reality of a real meal. Although the literature has revealed that the results of an OGTT is a better predictor of cardiovascular events and all-cause mortality than fasting blood glucose (FBG) the OGTT is not a real meal and represents only a surrogate for a real meal. So a group of researchers decided
“To evaluate whether postprandial blood glucose predicts cardiovascular events and all-cause mortality in type 2 diabetes in a long term follow-up taking into account A1c and the main cardiovascular risk factors.”
They found that both A1c and blood sugars measured 2 hours after lunch were predictors of cardiovascular events and death.
Remember, association does not prove causation. So what is going on here? How could higher blood sugar, even below the levels associated with diabetes, cause heart attacks, strokes and death?
Many complex mechanisms are likely involved. Three to consider include
- modification of LDL particles
- glycation of proteins throughout the body
- increased inflammation.
Recall that LDL particles carry cholesterol and fat (fatty acids) in the blood to deliver both cholesterol and fat to cells that need them. The various cells of our body have LDL receptors that engage the particle for docking and delivery.
As mentioned in previous posts, modified LDL particles are great stimulators for the development of atherosclerotic plaques in the walls of arteries. Modified LDL particles stimulate cells of the immune system to transform and become disposal units for the modified LDL. Unfortunately, the disposal process leads to deposition of the remnants of this process in the wall of our artery, creating a plaque (atherosclerotic plaque).
LDL particles can be modified by oxidation (the polyunsaturated fats on the surface of LDL become oxidized, remember saturated fats are not easily oxidized ) or by having sugar attach to the protein that envelopes the LDL particle (creating glycated LDL). Both forms of modified LDL (glycated and oxidized) are involved with atherosclerosis. Both forms stimulate the immune system to react as described above.
So far we have discussed the data for “normal blood sugar” levels wreaking havoc with respect to heart attack and stroke, but the same applies to other potential forms of damage including peripheral artery disease, kidney failure, peripheral neuropathy, cataracts, and dementia to name a few. All of these involve increased risk associated with higher blood sugar levels, inflammation and probably the glycation of various proteins in the body that are essential to normal function of our cells. When this glycation occurs we refer to the glycated proteins as advanced glycation end products (AGEs).
Glycosylation weakens the tight junction between the endothelial cells that line the arteries making them leaky and vulnerable to tears. Glycosylation of proteins in the lens of the eye creates cataracts. Glycosylation in the tiny blood vessels in the back of the eye makes them leak and bleed and can cause diabetic retinopathy, a leading cause of blindness. Glycosylation of the collagen in the skin makes skin less elastic and stiffer (aging skin). Glycosylation of collagen in your joints impairs joint mobility and can lead to arthritis. Glycosylation of the elastic tissue in lungs can impair pulmonary function.
AGEs disrupt the normal function of cells, no matter what organ is involved, and as AGEs accumulate we literally age. The human body has a way to deal with AGEs. There are mechanisms to rid ourselves of AGEs but if production exceeds elimination the imbalance leads to disease and this can occur anywhere in the body.
We have been talking about blood glucose but what about fructose? Fructose is handled by the human body in a manner very different from glucose. In overweight and obese humans fructose compared to glucose in equal caloric amounts over a 10 week period causes.
- increased fasting glucose
- increased fasting insulin levels,
- decreased insulin sensitivity,
- increased production of fat in the liver,
- increased fasting levels of oxidized LDL,
- increased fasting levels of small dense LDL (considered to be more atherogenic than large buoyant LDL)
- increased blood levels of pro-inflammatory and pro-thrombotic (blood clot forming) mediators
- Increased uric acid
This list represents some but not all of the differences as discussed in many papers including the following.
In addition,
- Fructose is 10 times more reactive in the formation of AGEs than is glucose.
- Fructose appears to cause changes in the brain that may lead to overeating. These findings are published in the January 2, 2013 issue of the Journal of the American Medical Association.
- Fructose consumption in young men and women increases LDL-cholesterol, apolipprotein B and triglycerides.
- In rhesus monkeys fructose consumption provides a model for insulin resistance, metabolic syndrome, and type 2 diabetes.
- Fructose consumption for 10 weeks reduces energy expenditure and the burning of fat in overweight and obese men and women.
Arguably, the 68 pounds per year of corn syryp that American adults consume (along with the other 68 pounds of added sugar) have contributed significantly to the obesity epidemic in the US.
Dietary sugars: a fat difference.
And along with obesity and diabetes come increased risk of cognitive decline (demetia);
“The incidence of obesity has increased dramatically over the past several years, and in parallel, so has the prevalence of type 2 diabetes (T2D). Numerous studies have demonstrated that both obesity and T2D are associated with lower cognitive performance, cognitive decline, and dementia. Intake of dietary fructose has also increased. In fact, high-fructose corn syrup (HFCS) accounts for as much as 40% of caloric sweeteners used in the United States. Given the increase in the incidence of Alzheimer’s disease (AD), characterized by an age-related decline in memory and cognitive functioning, in this report we review the effects of obesity on cognitive performance and the impact of high fructose intake in promoting cognitive decline. The paper then considers the effects of omega-3 fatty acids (FAs), which have been linked to promising results in cognitive function including ameliorating the impact of a high-fructose diet.”
The emerging role of dietary fructose in obesity and … [Nutr J. 2013] – PubMed – NCBI
The relationship between dietary sugar, refined carbohydrates and obesity are explored in great detail in Good Calories, Bad Calories by Gary Taubes. Taubes presents convincing and consistent data that supports the thesis that dietary sugar and refined carbohydrates contribute significantly to our obesity epidemic and that fat consumption from whole foods including animal fat do not cause obesity or cardiovascular disease. The simple logic is that sugar and refined carbohydrates increase insulin levels which in turn causes storage of carbohydrate as fat and impairs the utilization of fat for energy. While many criticize Taubes thesis for being to simple, the physiologic effects of insulin on fat storage and energy utilization are not disputed.
The issue of blood sugar levels and glycosylation appears to be one of level and duration of exposure. If we plot blood sugar over time and draw a graph, the area under the curve of the graph represents total exposure to levels of blood sugar. If we draw a straight horizontal line under this curve that represents a toxic threshold (levels that result in glycosylation that exceed our ability to eliminate AGEs) then the area of toxicity is equal to the area above the threshold line and below the curve of blood sugar. In theory then we should live a lifestyle (nutrition, sleep, exercise, stress reduction) that results in keeping our blood sugars as close as possible to the threshold of toxicity. The Whitehall study suggests that line would be drawn at 86 mg/dl. this discussion provides a conceptual framework. There is no proof of this argument, just data that support the concept that as blood sugars stay elevated above a certain level, this elevation increases the risk of disease. When we examine this argument in the light of evolutionary medicine/health it makes sense. Before the onset of agriculture we did not consume added sweeteners, refined carbohydrates, refined “vegetable” oils (oils from seeds, grains and legumes), nor did we consume manufactured trans fats. So draw a horizontal line in the graph below at some level, make it 86 mg/dl, and look at the area between the blood sugar level and that horizontal line. That is the theoretical toxicity zone.
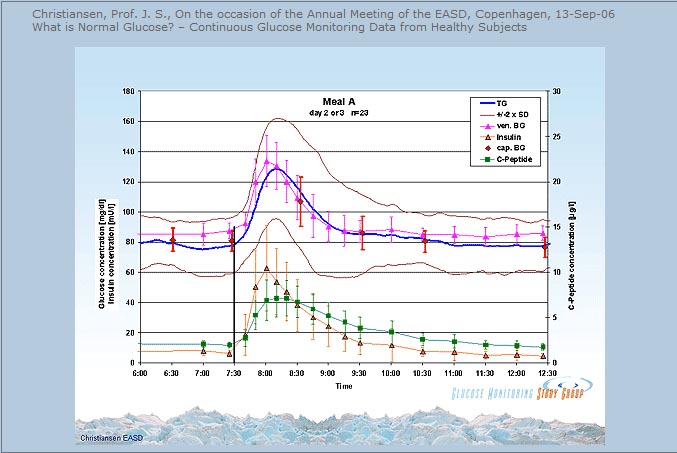
The association between “normal blood sugar levels” and risk of heart attack and stroke have been observed for a long time but this association has received much less attention than the concern over consumption of fat and cholesterol in the diet. In previous posts I have pointed out the evidence that contradicts the notion that consumption of saturated fat and cholesterol is a problem. Instead, there is growing evidence that easily oxidized polyunsaturated fat (vegetable oil) contributes to atherosclerosis , cardiovascular disease and chronic inflammation. Likewise, there is growing evidence that consumption of sweetened foods and beverages, as well as refined flour foods (which increase blood sugars much more than whole foods) are wreaking havoc in many ways.
So if there is a link between dietary sugar/refined carbohydrate consumption, blood sugar levels and disease, mediated by inflammation and glycosylation, what can we do about it? If there is a link between excessive consumption of pro-inflammatory and easily oxidized refined vegetable oils (linoleic acid) what can we do about it?
- Avoid sweetened food and beverages
- Drink only water and modest amounts of coffee or tea.
- Avoid flour foods and other forms of refined carbohydrate which result in blood sugar surges and over time stress the pancreas
- Eat only whole foods
- Save your carbs for dinner
- Walk for 15 minutes after every meal or 30-45 minutes per day
- Engage in resistance training (weight lifting, resistance bands) for 20-30 minutes twice per week.
- Get 8-9 hours of sleep each night
- And if you really want to get serious about nutritional changes, eat only the foods we have evolved to eat. Eat like a hunter-gatherer. Eat only pastured meat, free range poultry and free range eggs, fresh wild fish and seafood, fresh vegetables, fresh fruits and nuts. Avoid grains, legumes, dairy. Avoid refined vegetable oils. Do not eat any food with “partially hydrogenated oil” or “hydrogenated oil” of any kind.
Resistance training twice per week for just 20-30 minutes will increase muscle mass and insulin sensitivity, lower blood sugars, preserve bone density, and provide many health benefits.
Eating most carbs at dinner improved weight loss, lowered hunger, reduced abdominal circumference and enhanced body fat mass reductions in a calorie restricted weight loss study of obese adults.
Greater weight loss and hormonal cha… [Obesity (Silver Spring). 2011] – PubMed – NCBI
Sleep deprivation impairs insulin sensitivity, increases the risk of diabetes, hypertension, cardiovascular disease, depression, accidents and cancer, impairs immune function and wound healing, and impairs weight loss on a calorie restricted diet.
Meta-Analysis of Short Sleep Duration and Obesity in Children and Adults
Sleep duration and body mass index in twins: a gene-en… [Sleep. 2012] – PubMed – NCBI
Impact of insufficient sleep on total daily energy expenditure, food intake, and weight gain.
Neurobiological consequences of sleep deprivation.
Sleep and type 2 diabetes mellitus- clinical implications.
The influence of shift work on cognitive functions and oxidative stress.
The impact of sleep deprivation on food desire in the human brain.
Walking 15 minutes after every meal in adults 60 years and older significantly improved 24 hour blood glucose control relative to control subjects who did not walk and was significantly more effective than 45 minutes of sustained morning or afternoon walking in lowering 3 hour post-dinner glucose levels.
Food, sleep, exercise and stress are the primary determinants of health.
While this post discussed two of three proposed mechanisms linking blood sugar levels to disease (modified LDL and AGEs) I did not discuss inflammation. The relationship between dietary sugar, refined carbohydrates and inflammation will be discussed in future posts.
In the meantime, stay tuned for “an egg a day keeps the doctor away”.
Peace,
Bob Hansen MD

