Tag Archives: CHD

Fat consumption, Fat circulating in your blood, Heart Disease

Another nail has been driven into the coffin of the diet-heart hypothesis. The Annals of Internal Medicine (the official journal for the American College of Physicians) just published a review article that considered three kinds of studies related to fat and heart disease. (1)

  1. Studies that evaluated the association between dietary consumption of different kinds of fat and cardiovascular disease (heart attack and stroke)
  2. Studies that evaluated the association between levels of different kinds of fat circulating in the blood and cardiovascular disease
  3. Studies that evaluated supplementation with various kinds of fat and cardiovascular disease.

Most importantly, the authors found no statistical association between consumption of saturated fat and cardiovascular disease. I have previously discussed another large meta-analysis published in 2010 with the same finding. (2)

I have discussed the unscientific demonization of saturated fat many times (3,4,5).

This is important because it again speaks against the dietary advice promulgated by the AHA and the USDA to reduce consumption of saturated fat. The low-fat advice has resulted in a proliferation of low-fat high-sugar and high-carbohydrate food products which arguably have contributed to the epidemics of obesity and diabetes in the US.

Similarly, recent studies have correlated dementia with high carbohydrate consumption. (6) If you reduce fat in the diet you must replace it with something else and unfortunately in the US that something else has been sugar and other refined carbohydrates.

Other statistically significant findings in the Annals of Internal Medicine study were an inverse relationship between circulating blood levels of the omega three fats found in seafood (EPA and DHA) and cardiovascular events. The authors pointed out that although higher blood levels of EPA and DHA were significantly associated with lower cardiovascular risk, supplementation with EPA and DHA have had mixed results  with many studies showing positive results but some showing no protective effects. My comments on the omega three supplement studies are

  1. supplementation with fish oil (omega three fats) will not benefit most individuals unless excess pro-inflammatory omega six fats (found in refined vegetable oils) are reduced/eliminated and that side of the equation has not been addressed in any of the published studies. In other words, the studies did not reduce omega 6 fats, they just supplemented with omega 3 fat. If an individual is consuming 30-60 grams of omega six fats per day, trying to balance that with 2-3 grams per day of fish oil will not achieve a healthy ratio.
  2. many of the fish oil (omega three) supplement studies used very low amounts of fish oil, well below the amounts used in the studies that demonstrated benefit.

I am not suggesting that everyone should take fish oil supplements. Instead, I support eating a whole foods paleolithic diet based on grass-fed meat, free range poultry, free range eggs, fresh wild seafood, fresh vegetables, fresh fruits and nuts.

Finally, the data on trans-fat consumption demonstrated statistically significant correlation with cardiovascular disease. The biochemistry and physiology of manufactured trans-fats demonstrate a disruptive role of these man-made fats and the elimination of these harmful fats from our food supply will likely provide great health benefits.

The authors comment on the complex relationship between fat consumption and circulating levels of specific fats in the blood as demonstrated by Forsythe et al. (6,7) I will discuss this in future posts. For now consider the paradox that high-fat carbohydrate restricted diets result in lower circulating levels of saturated fat compared to high carbohydrate diets. (6,7), Explanation: excess carbohydrates are immediately converted to fat and stored as saturated fat by humans.

1. Annals of Internal Medicine | Association of Dietary, Circulating, and Supplement Fatty Acids With Coronary Risk: A Systematic Review and Meta-analysis

2. Siri-Tarino PW, Sun Q, Hu FB, Krauss RM. Meta-analysis of prospective cohort studies evaluating the association of saturated fat with cardiovascular disease. Am J Clin Nutr. 2010; 91:535-46.
PubMed

3. https://practical-evolutionary-health.com/2014/02/16/can-goose-liver-grass-fed-meat-aged-hard-cheese-free-range-eggs-and-cod-liver-oil-prevent-a-heart-attack/

4. https://practical-evolutionary-health.com/2013/11/03/saturated-fat-vs-sugar/

5. https://practical-evolutionary-health.com/2013/11/01/saturated-fat-does-it-matter/

6. Relative intake of macronutrients impacts risk of mild cognitive impairment or dementia. Journal of Alzheimers Dis. 2012;32(2):329-39. doi: 10.3233/JAD-2012-120862.

7. Forsythe CE, Phinney SD, Feinman RD, Volk BM, Freidenreich D, Quann E, et al. Limited effect of dietary saturated fat on plasma saturated fat in the context of a low carbohydrate diet. Lipids. 2010; 45:947-62. PubMed

8. Forsythe CE, Phinney SD, Fernandez ML, Quann EE, Wood RJ, Bibus DM, et al. Comparison of low fat and low carbohydrate diets on circulating fatty acid composition and markers of inflammation. Lipids. 2008; 43:65-77. PubMed

Peace,

Bob Hansen MD

Can goose liver, grass-fed meat, aged hard cheese, free range eggs and cod liver oil prevent a heart attack?

The data suggests that the answer is yes. The first four of these health foods are rich sources of vitamin K2 and the last food item is packed with Vitamins A and D. The proposed mechanism for their protective effect rests in a wonderful biological quartet. The instruments of this quartet include  the fat soluble vitamins D, K2, and A playing harmoniously  with a ubiquitous human protein called Matrix gla protein  (MGP).

The basic science is exquisite. Vitamins D and A acting together enhance the expression of MGP.  In other words, these two fat-soluble vitamins cause our bodies to increase the production of MGP.  MGP resides throughout our bodies including the walls of our arteries. Vitamin K2 then activates the MGP which in turn regulates (prevents) the calcification of plaque in the walls of our arteries. MGP masterfully plays this role in many arteries and it’s artistry is particularly effective in the coronary arteries that supply blood and oxygen to heart muscle.

Heavily calcified coronary plaque (the nasty stuff that produces atherosclerosis) as compared to un-calcified plaque is much more likely to rupture and create an acute blockage, thereby causing a heart attack. By inhibiting calcification of coronary plaque activated MGP decreases the risk of a heart attack. The biochemistry and physiology of this process are well accepted and discussed in the opening of several papers that address this topic. (1,2,3)

The data that support this theory includes a lot of basic science that describes the interaction between the four players as well as nutritional studies in humans and rodents.

The first major human study was the Rotterdam study published in the Journal of the American Society for Nutritional Sciences, 2004. Here is a quote from the summary.

“Vitamin K-dependent proteins, including matrix Gla-protein, have been shown to inhibit vascular calcification. Activation of these proteins via carboxylation depends on the availability of vitamin K. We examined whether dietary intake of phylloquinone (vitamin K-1) and menaquinone (vitamin K-2) were related to aortic calcification and coronary heart disease (CHD) in the population-based Rotterdam Study.”

The study followed 4801 adults for over 7 years and analyzed the relationship between Vitamin K intake and incidence of heart attacks, (fatal and non-fatal), death from all causes, and atherosclerosis in the aorta (the major artery of the body). The results were impressive. The analysis divided the 4801 people into three equal groups, 1/3 with the highest consumption of Vitamin K, 1/3 with the lowest consumption, and 1/3 in the middle. The higher and middle groups compared to the group with the lowest consumption had:

  • significantly fewer non-fatal heart attacks,
  • significantly fewer deaths from heart attack,
  • significantly fewer deaths from all causes.

In addition, the group with the highest consumption of Vitamin K2 had significantly less calcified plaque in the walls of their aortas.

Comparing the group of the highest intake of vitamin K2 to the group with the lowest intake, the highest intake group had 41% less risk of non-fatal heart attack, 57% lower risk of death from heart attack and 26% lower risk of  death from all causes after adjusting for multiple factors that are believed to play a role in heart attack risk.  (Those other factors included age, gender, total energy intake, BMI, smoking status, pack-years smoking, diabetes, education, alcohol consumption. consumption of saturated fat, poly unsaturated fat, flavonoids (anti-oxidants) and calcium.)

Vitamin K2  consumption showed these significant associations whereas Vitamin K1 did not. Vitamin K2 is found most abundantly in animal foods that contain  erroneously demonized saturated fat, Vitamin K1 is found in plants that do not contain much if any saturated fat. So this represents not only a strong statistical signal for the health benefit of Vitamin K2, but also supports the health benefit of consuming animal foods with saturated fat. The individuals who consumed more meat and more full fat fermented cheese (the two major sources of vitamin K2 in this study) had dramatically reduced risk of heart attack (both fatal and non-fatal), reduced risk of death from all causes, and less calcified plaque in the major artery of the body, the aorta. Vitamin K2 is a fat soluble vitamin which means it comes with the fat in these foods. Eating low fat foods misses this healthy opportunity.

Five years after the Rotterdam study was published, another study demonstrated similar findings. The title tells the story.

“A high menaquinone (vitamin K2) intake reduces the incidence of coronary heart disease.”

This study followed 16,057 women aged 49-70 years for 8 years. The study participants had no known heart disease at the start of the study. The results:

“After adjustment for traditional risk factors and (other) dietary factors, we observed an inverse association between vitamin K(2) and risk of CHD with a Hazard Ratio (HR) of 0.91 [95% CI 0.85-1.00] per 10 microg/d vitamin K(2) intake.”

Translation: for every increase in daily consumption of vitamin K2 by 10 micrograms per day, there was an average 9% reduction in risk of coronary disease events.

Let’s look at how much Vitamin K2 was consumed in the three groups described in the first study. Going from the lowest to the highest daily consumption the groups averaged 15.1, 26.9 and 40.9 micrograms per day. To put this in perspective, you can view a table of the Vitamin K2 content of various foods produced by Chris Masterjohn, a portion of which appears below. Before you do that, let me explain some facts about Vitamin K2.

Vitamin K2 actually represents a group of very similar vitamins that differ chemically only  in the number of specific chemical side chains. The  number of these side chains varies from 4 to 10, so these are referred to as MK-4 through MK-10. From Wikepedia:

All K vitamins are similar in structure: they share a “quinone” ring, but differ in the length and degree of saturation of the carbon tail and the number of “side chains”.[1] The number of side chains is indicated in the name of the particular menaquinone (e.g., MK-4 means that four molecular units – called isoprene units – are attached to the carbon tail) and this influences the transport to different target tissues.

MK-4 is made in the tissue of grass-eating mammals that convert Vitamin K1 (from the green plants) to Vitamin K2 (MK-4). This can be obtained from animal muscle, organ meats, or the milk and milk products of mammals, including human breast milk.

The other forms of Vitamin K-2 (side-chain length > 4) are made by bacteria during the fermentation of foods (such as cheese, sauerkraut, kim chee and Natto). Here is the table from Chris Masterjohn. Go here for the original table.

The percentage of vitamin K2 present as MK-4 represents that synthesized by animal tissues, while the remainder represents that synthesized by bacteria during fermentation.

FOOD VITAMIN K2 (MCG/100G)
Natto 1103.4 (0% MK-4)
Goose Liver Paste 369.0 (100% MK-4)
Hard Cheeses 76.3 (6% MK-4)
Soft Cheeses 56.5 (6.5% MK-4)
Egg Yolk (Netherlands) 32.1 (98% MK-4)
Goose Leg 31.0 (100% MK-4)
Curd Cheeses 24.8 (1.6% MK-4)
Egg Yolk (United States) 15.5 (100% MK-4)
Butter 15.0 (100% MK-4)
Chicken Liver 14.1 (100% MK-4)
Salami 9.0 (100% MK-4)
Chicken Breast 8.9 (100% MK-4)
Chicken Leg 8.5 (100% MK-4)
Ground Beef (Medium Fat) 8.1 (100% MK-4)
Bacon 5.6 (100% MK-4)
Calf Liver 5.0 (100% MK-4)
Sauerkraut 4.8 (8% MK-4)
Whole Milk 1.0 (100% MK-4)

Where did our paleolithic hunter-gatherer ancestors get their Vitamin K2? They did not consume dairy products. Vitamin K2 is heavily concentrated in the pancreas, brain and liver of humans and animals. Hunter-gatherers do not waste these valuable fatty organs, in fact offal was deemed the most treasured part of a successful hunt among many hunter-gatherer societies studied during the 19th and 20th centuries.

Not many Americans eat offal such as pancreas, brain and liver so similar to Holland (where these studies were conducted) most Vitamin K2 in the American diet probably comes from hard cheese and egg yolks.

But what is the weakness in drawing conclusions from these two studies?

First they were epidemiological studies, the data was obtained from FFQs (food frequency questionnaires). They were not randomized controlled clinical trials (RCTs). There have been no RCTs that have looked specifically at Vitamin K2 relative to coronary artery disease and deaths. Having said that, you should be aware that most nutrition studies that have been published (in particular those that  demonize saturated fat ) fall into the same category, they are epidemiological studies based upon food frequency questionnaires (FFQs) and such studies have been criticized with regards to reliability of data and for lack of controlling the multiple dietary and non-dietary factors that can influence health outcomes.(4)

Unlike the two studies discussed here that statistically adjusted for multiple known or argued risk factors, the epidemiologic studies that are alleged to suggest potential harm from saturated fat did not control or adjust for other statistical “con-founders”. In addition, the review papers that have so overwhelmed our society causing fat-phobia have ignored the large body of evidence that demonstrates the health benefits of consuming animal foods that contain fat soluble vitamins as well as many other vital nutrients. (4)

Regarding randomized controlled trials, there have been many convincing RCTs in rodents that demonstrate not only prevention of calcified plaques in arterial walls but actual reversal of atherosclerosis in rodents with high doses of vitamin K2. (5)  Furthermore, a certain breed of experimental rodent that completely lacks MGP suffers from early death caused by severe atherosclerosis further supporting the fundamental role of activated MGP in maintaining vascular health. (6)

1. Dietary Intake of Menaquinone Is Associated with a Reduced Risk of Coronary Heart Disease: The Rotterdam Study

2. A high menaquinone intake reduces … [Nutr Metab Cardiovasc Dis. 2009] – PubMed – NCBI

3. Vitamin K status and vascular calcification: eviden… [Adv Nutr. 2012] – PubMed – NCBI

4. Dietary Fats and Health: Dietary Recommendations in the Context of Scientific Evidence

5. Regression of warfarin-induced medial elastocalcinosis… [Blood. 2007] – PubMed – NCBI

6. Two sides of MGP null arterial disease: chondrogenic lesions dependent on transglutaminase 2 and elastin fragmentation associated with induction of adipsin.

The Ornish Low Fat Vegetarian Diet, does it work?

Dr. Dean Ornish has done wonderful research in the area of cardiovascular disease and lifestyle intervention. His study on comprehensive lifestyle intervention (1) is often quoted to support a low fat vegetarian diet as treatment for cardiovascular disease. But his “Intensive lifestyle changes for reversal of coronary heart disease” included several components that would be expected to improve health and decrease cardiovascular risk independent of a vegetarian diet as will be discussed below.

Let’s review what this study did.

48 patients with diagnosed moderate to severe coronary artery disease were randomized to one of two treatment groups, an “intensive lifestyle change” (ILC) group or a “usual-care” (UC) control group. 28 patients were allocated randomly to the ILC group and 20 were allocated to the UC group. Out of 48 patients starting the study only 35 completed the study,   20 out of 28 in the ILC group completed the study and 15 out of 20 in the UC group completed the study.

The intensive lifestyle change group followed this program:

  • 10% fat whole foods vegetarian diet
  • daily aerobic exercise
  • stress management training (training in and daily performance of meditation and/or yoga)
  • smoke cessation (they quit smoking)
  • group psychosocial support (3 hour group therapy sessions)

At the start of the study only one patient in the ILC group was smoking and she quit. We do not know how many smokers were in the UC group or how many quit. (I consider that a deficiency of this study. Because smoking is such a significant determinant of cardiovascular outcome, details of smoking at start and end of the study for both groups should have been reported)

At the end of five years the intensive lifestyle change group demonstrated an average 3.1% absolute reduction in the coronary artery blockage as measured by coronary arteriograms (or to put it another way, the diameter of the blocked coronary arteries increased by 3.1%). The usual care group (receiving cholesterol lowering statin drugs) showed an average 2.3% absolute increase in the coronary artery blockage (2.3% reduction in diameter). These are not huge changes or differences but they were measurable and statistically significant.

Twenty five total  “cardiac events” occurred in the 28 patients randomized to the intensive lifestyle change group over the five years and 45 cardiac events occurred in the 20 patients randomized to the “usual care” group (receiving cholesterol lowering statin drugs). But this was due to differences in the number of hospitalizations and angioplasties. There was no statistically significant difference in the number of deaths, heart attacks or coronary artery bypass surgeries.

By the end of the study 2 patients in the ILC group had died compared to 1 death in the usual care group but as mentioned above, this difference was not statistically significant.  We do not know how many deaths occurred in the 8 patients who dropped out of the treatment group or in the 5 patients who dropped out of the usual care group, nor do we know any of the other outcomes for the drop-out patients.

So there were no lives saved by the intensive lifestyle change program and no reduction in the number of heart attacks. In fact the ILC group had 2 deaths compared to 1 in the usual care group.

What does this all mean and why has the Ornish Diet attracted so much attention.?

First, I would suggest that the demonstrated benefits (reductions in the number of angioplasties and hospitalizations) are likely explained by the following parts of the lifestyle changes.

  1. stress reduction training and implementation (meditation and yoga)
  2. elimination of manufactured trans-fats from the diet
  3. elimination of unhealthy pro-inflammatory excess omega six fats (vegetable oils) from the diet
  4. elimination/reduction of processed carbohydrates and sugar.

Although the intensive lifestyle intervention included regular exercise the data show no significant difference in times per week or hours per week of exercise at the end of the study between the two groups.

The big difference was in stress management. The ILC group averaged practicing meditation and/or yoga 5 times per week (48 minutes per day) versus less that once per week (8 minutes per day) in the usual care group.

Stress reduction is a major issue in any disease and in particular in cardiovascular disease.

Several studies have demonstrated that the daily practice of meditation  improves immune function, increases telomerase activity, reduces inflammatory markers, and reduces circulating stress hormones (cortisol and epinephrine) independent of dietary changes.
Meditation has also been observed to improve “endothelial function”, the ability of the cells that line arteries to respond to changes in demand. (2,3,4,5,6,7)

Here is a press release from the American Heart Association 13 November 2012. (8)

“African Americans with heart disease who practiced Transcendental Meditation regularly were 48 percent less likely to have a heart attack, stroke or die from all causes compared with African Americans who attended a health education class over more than five years, according to new research published in the American Heart Association journal Circulation: Cardiovascular Quality and Outcomes.

Those practicing meditation also lowered their blood pressure and reported less stress and anger. And the more regularly patients meditated, the greater their survival, said researchers who conducted the study at the Medical College of Wisconsin in Milwaukee.”

I believe the major benefit of the interventional program was from the stress reduction and the elimination of three major dietary sources of trouble (trans-fats, excess omega 6 fats from processed-refined vegetable oils, and refined carbohydrates-sugar)

I have already discussed in other posts the problems associated with excess omega 6 fats and refined carbohydrates-sugar relative to cardiovascular risk. (9,10,11)

There is little controversy that elimination/reduction in trans-fats produces benefit. (12,13,14)

All three of these changes were essential to the whole foods approach of the intervention group.

I have also discussed the lack of data to support the contention that saturated fat from animal sources of protein contributes to cardiovascular disease. (15, 16))

I remain a strong proponent of a whole foods diet that includes a variety and abundance of organic vegetables and fruits, nuts, pastured grass-fed meat, fresh wild seafood, free-range organic poultry and eggs from that kind of poultry.  This diet represents the foods we have evolved to eat, free from added sugar, hormones, antibiotics, pesticides. This dietary approach also produces a healthy balance of omega 6 to omega 3 fatty acid as well as a significant improvement in the ratio of potassium to sodium.

Stress reduction should be an essential part of our lives and data on this aspect of health will be discussed in future posts. References for this discussion appear below.

Peace,

BOB Hansen MD

REFERENCES:

1. JAMA Network | JAMA | Intensive Lifestyle Changes for Reversal of Coronary Heart Disease

2. Intensive meditation training, immune cell telomerase activity, and psychological mediators.

3. Can meditation slow rate of cellular aging? Cognitive stress, mindfulness, and telomeres.

4. A pilot study of yogic meditation for family dementia caregivers with depressive symptoms: effects on mental health, cognition, and telomerase activity.

5. Meditation Improves Endothelial Function in Metabolic Syndrome, American Psychosomatic Society (APS) 69th Annual Scientific Meeting: Abstract 1639. Presented March 10, 2011.

6. Alterations in brain and immune function produced by mindfulness meditation.

7. Adrenocortical activity during meditation.

8. Meditation may reduce death, heart attack and stroke in heart patients | American Heart Association

9. Polyunsaturated fat, Saturated fat and the AHA

10, Lose weight, control blood sugar, reduce inflammation

11. Sugar, a serious addiction

12. The negative effects of hydrogenated trans fats and what to do about them.

13. Trans fats in America: a review of their use… [J Am Diet Assoc. 2010] – PubMed – NCBI

14. FDA to Ban Trans Fats in Foods – US News and World Report

15. saturated fat | Practical Evolutionary Health

16. Meta-analysis of prospective cohort studies evaluating the association of saturated fat with cardiovascular disease.

Statin Guidelines, one step forward, two steps backwards

The new statin guidelines published jointly by the AHA (American Heart Association) and ACC (American College of Cardiology) present some good news but also allot of bad news.

The good news (one step forward) is that the guidelines acknowledge the following:

1. None of the cholesterol lowering drugs (except for statins) have ever demonstrated the ability to save lives by lowering cholesterol.

2. The ability of statin drugs to save lives (after a heart attack) is independent of whether and by how much the cholesterol is lowered.

This acknowledgement is very important because it sheds light on the fact that statins work primarily by effects independent of how much cholesterol is circulating in the blood. This is a fact that is not well understood by many physicians or patients. This fact will create some confusion because the American public has been misinformed for many years by physicians, the media and professional organizations all using terms like “good cholesterol” and “bad cholesterol”. These terms are meaningless, confusing, and counter-productive.

The new guidelines are two steps backwards for a few reasons:

1. They expand the number of patients under the guidelines in the US by tens of millions of people who will not benefit from their use and implementation of the guidelines will likely harm many.

2. The guidelines continue to assume and quote unrealistically low and inaccurate complication rates.

3. The risk assessment tool that accompanies the guidelines over-estimates risk for heart attack and stroke by 75-150%. This calculation of the over-estimate is based upon application of the guidelines to a huge database of real patients. This analysis has been published in a Peer Reviewed Journal and this analysis has already been discussed by the lay-press to the embarrassment of the AHA and ACC. This particular concern was communicated to the guideline committee one year ago by a prominent research cardiologist and statistician on the faculty of Harvard Medical School, but ignored by the guideline committee.

4. The guidelines have lowered the recommended 10 year  risk threshold for use of statins from the previous 10-20% level to a 7.5% level (thereby tremendously increasing the number of people who would be placed on statins). And since the risk calculator, as discussed in #3 above, greatly inflates the risk it essentially would apply the statin guidelines in reality to individuals with only a 3.75 to 4% risk of a cardiovascular event in the next 10 years. This shifts the risk/benefit ratio to a much higher level than the already high risk/benefit ratio of the previous guidelines.

Gratefully the excessive use of statins as well as the folly of the previous and new guidelines have  been brought to the public arena and the debate has finally drawn attention. Perhaps some reasonable discussion will ensue and perhaps the medical community at large will finally think about the bias represented in policy statements and guidelines as well as the bias presented in the many review articles that have been published on this topic.

Here are links to some reading of recent articles in the lay press.

Cholesterol Guidelines Under Attack – NYTimes.com

New Cholesterol Advice Startles Even Some Doctors – NYTimes.com

Risk Calculator for Cholesterol Appears Flawed – NYTimes.com

“After the guidelines were published, two Harvard Medical School professors identified flaws in the risk calculator that apparently had been discovered a year ago but were never fixed, as Gina Kolata reported in The Times on Monday.

In a commentary to be published Tuesday in The Lancet, a leading medical journal, the professors estimate that as many as half of the 33 million do not actually have risk thresholds exceeding the 7.5 percent level. Other experts who have tested the calculator found absurd results; even patients with healthy characteristics would be deemed candidates for statins.”

Be careful out there.

Peace,

Bob Hansen MD

Sugar, a serious addiction

Sugar affects the pleasure centers of the brain in a manner much the same as cocaine, heroin, and other addictive substances. In that respect Americans are addicted to sugar. The average American consumes 136 pounds of added sugar per year. This includes 68 pounds of high fructose corn syrup (HFCS) and other corn-derived sweetener. These figures do not include the amount of natural sugar found in whole foods. These figures cover only the sugar added to food and beverages to make them sweeter.

From wikipedia:

“Sugar is the generalized name for a class of chemically-related sweet-flavored substances, most of which are used as food. They are carbohydrates, composed of carbon, hydrogen and oxygen. There are various types of sugar derived from different sources. Simple sugars are called monosaccharides and include glucose (also known as dextrose), fructose and galactose. The table or granulated sugar most customarily used as food is sucrose, a disaccharide (in the body, sucrose hydrolyses into fructose and glucose). Other disaccharides include maltose and lactose. Chemically-different substances may also have a sweet taste, but are not classified as sugars. Some are used as lower-calorie food substitutes for sugar described as artificial sweeteners.”

“The most widely used varieties of HFCS are: HFCS 55 (mostly used in soft drinks), approximately 55% fructose and 42% glucose; and HFCS 42 (used in beverages, processed foods, cereals, and baked goods), approximately 42% fructose and 53% glucose”

also from Wikipedia:

“It used to be believed that sugar raised blood glucose levels more quickly than did starch because of its simpler chemical structure. However, it turned out that white bread or French fries have the same effect on blood sugar as pure glucose, while fructose, although a simple carbohydrate, has a minimal effect on blood sugar. As a result, as far as blood sugar is concerned, carbohydrates are classified according to their glycemic index, a system for measuring how quickly a food that is eaten raises blood sugar levels, and glycemic load, which takes into account both the glycemic index and the amount of carbohydrate in the food.[60]”

Our blood sugars (glucose level measured as milligrams per deciliter or mg/dl) rise after every meal or snack and our body responds with the secretion of insulin from the pancreas to enable efficient processing of the sugar. Insulin facilitates the uptake of glucose into cells for utilization as energy and storage as starch (glycogen) or fat. Since glycogen storage capacity in the human body is relatively small (equivalent to two hours of hard labor) and filled quickly, most caloric intake that is not used immediately for work gets stored as fat.

Diabetics have higher blood sugars than “normal” people after an overnight fast as well as after a meal. But the definition of a “normal” fasting blood sugar as compared to a diabetic or “pre-diabetic” level is quite arbitrary. Likewise the definition of a “normal” blood sugar 2 hours after swallowing 75 grams of sugar ( oral glucose tolerance test or OGTT) is also quite arbitrary.

Now the story becomes alarming. Blood sugar levels measured 2 hours after a challenge with 50 or 75 grams of oral sugar intake  that are below the diabetic range are associated with a significantly  increased risk of heart attack and stroke. Likewise, hemoglobin A1c levels (A1c) below the diabetic range are also associated with increased risk of heart attack. Hemoglobin is the protein in red blood cells that carries and delivers oxygen throughout our bodies. A1c is a measurement of the %  hemoglobin that has a molecule of sugar attached to it. A1c is thought to reflect the average amount of blood sugar during the prior 3 months (the average life of a red blood cell is 3 months). A1c is also called glycated hemoglobin.

So let’s discuss some data.

The Whitehall study followed 17,869 male civil servants aged 40-64 in England for 33 years. They measured the blood sugar 2 hours after consumption of 50 grams of glucose at the start of the study and recorded death from all causes, cardiovascular causes, and respiratory causes and cancers during the 33 year period. They found a direct linear relationship between the baseline 2 hour blood sugar measurement and the risk of coronary death over 33 years. The higher the blood sugar two hours after the sugar drink, the greater the risk of death from a cardiac event. This relationship held true for blood sugars starting at 83 mg/dl (considered normal). There was a dose response relationship between 83 mg/dl and 200 mg/dl. The linear relationship was attenuated by 45% after adjustment for baseline coronary heart disease, BMI, systolic blood pressure, blood cholesterol, smoking, physical activity, lung function and employment grade. They also found that glucose intolerance (post-load blood glucose level 96-200 mg/dl) is associated with increased mortality risk from all causes, stroke, and respiratory disease but not all cancers. At the time of this study publication diabetes was defined as a two hour blood sugar response greater than 200 mg/dl, responses between 96 and 200 were labeled glucose intolerance.

They stated:

Our findings are consistent with recent meta-analyses of post-load glucose and CVD mortality that have assembled results from diverse population-based studies of non diabetic subjects and shown the effect of glucose intolerance on risk over median follow-up of 9-12 years.

Relation between blood glucose and coronary mortality over 33 years in theWhitehall Study.

A study in 2009 showed that patients who did not meet the ADA definition of diabetes (2 hour blood sugar  > 140 mg/dl using 75 gm of glucose) but had elevated  one hour glucose tolerance test (> 155 mg/dl) had “sub clinical inflammation, high lipid ratios and insulin resistance.” These translate into increased cardiovascular risk.

Inflammation markers and metabolic characteristics of subjects with one-hour plasma glucose levels

Hemoglobin A1c is a measurement of the amount of sugar attached to the hemoglobin protein in the red blood cells that carry oxygen in the blood. It is thought to reflect an average blood sugar level during the previous 2-3 months. A1c > 6.5% is considered diagnostic for diabetes. But cardiovascular risk increases at  A1c levels well below the level associated with diabetes. In one non-diabetic adults with A1c below 5% had the lowest rates of cardiovascular disease. Cardiovascular disease and death increased by 24 % for every 1% rise above A1c of 5% in non-diabetics.

Association of Hemoglobin A1c with Cardiovascular Disease and Mortality in Adults: The European Prospective Investigation into Cancer in Norfolk.

In another study heart disease risk increased as A1c rose above 4.6%, a level that corresponds to an average blood sugar level of 86 mg/dl, remarkably close to the threshold of 83 mg/dl found in the Whitehall study.

In non diabetic adults, HbA1c level was not related to CHD risk below a level of 4.6% but was significantly related to risk above that level (P<.001). In diabetic adults, the risk of CHD increased throughout the range of HbA1c levels. In the adjusted model, the Risk Ratio of CHD for a 1 percentage point increase in HbA1c level was 2.36 (95% CI, 1.43-3.90) in persons without diabetes but with an HbA1c level greater than 4.6%. In diabetic adults, the Risk Ratio was 1.14 (95% CI, 1.07-1.21) per 1 percentage point increase in HbA1c across the full range of HbA1c values.”

In other words, A1c level of 5.6% vs 4.6% was associated with more than doubling the risk of CHD. That is a profound difference. (Statin drugs  reduced risk of cardiac mortality by 13%  in studies that mixed primary and secondary prophylaxis populations)

Glycemic Control and Coronary Heart Disease Risk in Persons With and Without Diabetes. The Atherosclerosis Risk in Communities Study.

In a study that followed 11,092 adults without diabetes or cardiovascular disease for 15 years the associations between A1c at baseline and the development of diabetes, coronary artery disease and stroke were evaluated.

Multivariate-Adjusted Hazard Ratio
A1c at baseline            coronary disease risk   diabetes risk                stroke risk
<5%                             0.96 (0.74-1.24)         0.52 (0.40 to 0.69)      1.09 (0.67-1.76)
5% to < 5.5%:             1.00 (reference)           1.00 (reference)           1.00
5.5% to < 6%:              1.23 (1.07-1.41)         1.86 (1.67 to 2.08)      1.23 (1.07-1.41)
6% to < 6.5%:              1.78 (1.48-2.15)         4.48 (3.92 to 5.13)      1.78 (1.48-2.15)
>= 6.5%:                     1.95 (1.53-2.48)          16.47 (14.22-19.08)    1.95 (1.53-2.48)

So below the range for diabetes, A1c levels in the range of 6 to <6.5% are associated with an increased the risk of heart disease and stroke by 78% an astounding amount in comparison to the purported effects of blood cholesterol. But this study had another interesting result.

“The association between the fasting glucose levels and the risk of cardiovascular disease or death from any cause was not significant in models with adjustment for all co-variates as well as glycated hemoglobin. For coronary heart disease, measures of risk discrimination showed significant improvement when glycated hemoglobin was added to models including fasting glucose.”

In other words, when A1c was included in a mathematical model of multiple risk factors the effect of fasting glucose on risk of cardiovascular disease disappeared. There are theoretical reasons to explain this but that is the topic of another post.

The authors summarized by saying.

“In this community-based population of non diabetic adults, glycated hemoglobin was similarly associated with a risk of diabetes and more strongly associated with risks of cardiovascular disease and death from any cause as compared with fasting glucose.”

Glycated Hemoglobin, Diabetes, and Cardiovascular Risk in Nondiabetic Adults.

Now some folks are concerned that the 2 hour blood sugar response to swallowing 75 grams of sugar does not reflect the reality of a real meal.  Although the literature has revealed that the results of an OGTT  is a better predictor of cardiovascular events and all-cause mortality than fasting blood glucose (FBG) the OGTT is not a real meal and represents only a surrogate for a real meal. So a group of researchers decided

“To evaluate whether postprandial blood glucose predicts cardiovascular events and all-cause mortality in type 2 diabetes in a long term follow-up taking into account A1c and the main cardiovascular risk factors.”

They found that both A1c and blood sugars measured 2 hours after lunch were predictors of cardiovascular events and death.

Postprandial Blood Glucose Predicts Cardiovascular Events and All-Cause Mortality in Type 2 Diabetes in a 14-Year Follow-Up Lessons from the San Luigi Gonzaga Diabetes Study

Remember, association does not prove causation. So what is going on here? How could higher blood sugar, even below the levels associated with diabetes, cause heart attacks, strokes and death?

Many complex mechanisms are likely involved.  Three to consider include

  1. modification of LDL particles
  2. glycation of proteins throughout the body
  3. increased inflammation.

Recall that LDL particles carry cholesterol and fat (fatty acids) in the blood to deliver both cholesterol and fat to cells that need them. The various cells of our body have LDL receptors that engage the particle for docking and delivery.

As  mentioned in previous posts, modified LDL particles are great stimulators for the development of atherosclerotic plaques in the walls of arteries. Modified LDL particles stimulate cells of the immune system to transform and become disposal units for the modified LDL. Unfortunately, the disposal process leads to deposition of the remnants of this process in the wall of our artery, creating a plaque (atherosclerotic plaque).

LDL particles can be modified by oxidation  (the polyunsaturated fats on the surface of LDL become oxidized, remember saturated fats are not easily oxidized ) or by having sugar attach to the protein that envelopes the LDL particle (creating glycated LDL). Both forms of modified LDL (glycated and oxidized) are involved with atherosclerosis. Both forms stimulate the immune system to react as described above.

So far we have discussed the data for “normal blood sugar” levels wreaking havoc with respect to heart attack and stroke, but the same applies to other potential forms of damage including peripheral artery disease, kidney failure, peripheral neuropathy, cataracts, and dementia to name a few. All of these involve increased risk associated with higher blood sugar levels,  inflammation and probably the glycation of various proteins in the body that are essential to normal function of our cells. When this glycation occurs we refer to the glycated proteins as advanced glycation end products (AGEs).

Glycosylation weakens the tight junction between the endothelial cells that line the arteries making them leaky and vulnerable to tears. Glycosylation of proteins in the lens of the eye creates cataracts. Glycosylation in the tiny blood vessels in the back of the eye makes them leak and bleed and can cause diabetic retinopathy, a leading cause of blindness. Glycosylation of the collagen in the skin makes skin less elastic and stiffer (aging skin). Glycosylation of collagen in your joints impairs joint mobility and can lead to arthritis. Glycosylation of the elastic tissue in lungs can impair pulmonary function.

AGEs disrupt the normal function of cells, no matter what organ is involved, and as AGEs accumulate we literally age. The human body has a way to deal with AGEs. There are mechanisms to rid ourselves of AGEs but if production exceeds elimination the imbalance leads to disease and this can occur anywhere in the body.

We have been talking about blood glucose but what about fructose? Fructose is handled by the human body in a manner very different from glucose. In overweight and obese humans fructose compared to glucose in equal caloric amounts over a 10 week period causes.

  1. increased fasting glucose
  2. increased fasting insulin levels,
  3. decreased insulin sensitivity,
  4. increased production of fat in the liver,
  5. increased fasting levels of oxidized LDL,
  6. increased fasting levels of small dense LDL (considered to be more atherogenic than large buoyant LDL)
  7. increased blood levels of pro-inflammatory and pro-thrombotic (blood clot forming) mediators
  8. Increased uric acid

This list represents some but not all of the differences as discussed in many papers including the following.

Consuming fructose-sweetened, not glucose-sweetened, beverages increases visceral adiposity and lipids and decreases insulin sensitivity in overweight/obese humans.

Consumption of fructose– but not glucose-sweetened beverages for 10 weeks increases circulating concentrations of uric acid, retinol binding protein-4, and gamma-glutamyl transferase activity in overweight/obese humans.

Circulating concentrations of monocyte chemoattractant protein-1, plasminogen activator inhibitor-1, and soluble leukocyte adhesion molecule-1 in overweight/obese men and women consuming fructose– or glucose-sweetened beverages for 10 weeks.

In addition,

  1. Fructose is 10 times more reactive in the formation of AGEs than is glucose.
  2. Fructose appears to cause changes in the brain that may lead to overeating. These findings are published in the January 2, 2013 issue of the Journal of the American Medical Association.
  3. Fructose consumption in young men and women increases LDL-cholesterol, apolipprotein B and triglycerides.
  4. In rhesus monkeys fructose consumption provides a model for insulin resistance, metabolic syndrome, and type 2 diabetes.
  5. Fructose consumption for 10 weeks reduces energy expenditure and the burning of fat in overweight and obese men and women.

Arguably, the 68 pounds per year of corn syryp that American adults consume (along with the other 68 pounds of added sugar) have contributed significantly to the obesity epidemic in the US.

Dietary sugars: a fat difference.

And along with obesity and diabetes come increased risk of cognitive decline (demetia);

“The incidence of obesity has increased dramatically over the past several years, and in parallel, so has the prevalence of type 2 diabetes (T2D). Numerous studies have demonstrated that both obesity and T2D are associated with lower cognitive performance, cognitive decline, and dementia. Intake of dietary fructose has also increased. In fact, high-fructose corn syrup (HFCS) accounts for as much as 40% of caloric sweeteners used in the United States. Given the increase in the incidence of Alzheimer’s disease (AD), characterized by an age-related decline in memory and cognitive functioning, in this report we review the effects of obesity on cognitive performance and the impact of high fructose intake in promoting cognitive decline. The paper then considers the effects of omega-3 fatty acids (FAs), which have been linked to promising results in cognitive function including ameliorating the impact of a high-fructose diet.”

The emerging role of dietary fructose in obesity and … [Nutr J. 2013] – PubMed – NCBI

The relationship between dietary sugar, refined carbohydrates and obesity are explored in great detail in Good Calories, Bad Calories by Gary Taubes. Taubes presents convincing and consistent data that supports the thesis that dietary sugar and refined carbohydrates contribute significantly to our obesity epidemic and that fat consumption from whole foods including animal fat do not cause obesity or cardiovascular disease. The simple logic is that sugar and refined carbohydrates increase insulin levels which in turn causes storage of carbohydrate as fat and impairs the utilization of fat for energy. While many criticize Taubes thesis for being to simple, the physiologic effects of insulin on fat storage and energy utilization are not disputed.

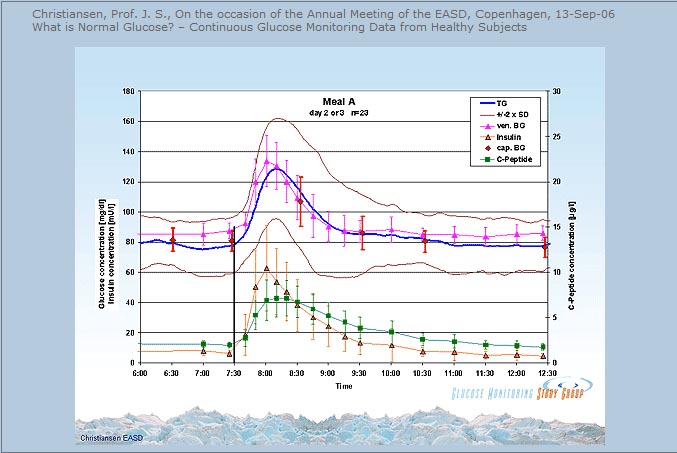
The issue of blood sugar levels and glycosylation appears to be one of level and duration of exposure. If we plot blood sugar over time and draw a graph, the area under the curve of the graph represents total exposure to  levels of blood sugar. If we draw a straight horizontal line under this curve that represents a toxic threshold (levels that result in glycosylation that exceed our ability to eliminate AGEs)  then the area of toxicity is equal to the area above the threshold line and below the curve of blood sugar. In theory then we should live a lifestyle (nutrition, sleep, exercise, stress reduction) that results in keeping our blood sugars as close as possible to the threshold of toxicity. The Whitehall study suggests that line would be drawn at 86 mg/dl. this discussion provides a conceptual framework. There is no proof of this argument, just data that support the concept that as blood sugars stay elevated above a certain level, this elevation increases the risk of disease. When we examine this argument in the light of evolutionary medicine/health it makes sense. Before the onset of agriculture we did not consume added sweeteners, refined carbohydrates, refined “vegetable” oils (oils from seeds, grains and legumes), nor did we consume manufactured trans fats. So draw a horizontal line in the graph below at some level, make it 86 mg/dl, and look at the area between the blood sugar level and that horizontal line. That is the theoretical toxicity zone.

blood sugar curve

The association between “normal blood sugar levels” and risk of heart attack and stroke have been observed for a long time but this association has received much less attention than the concern over consumption of fat and cholesterol in the diet. In previous posts I have pointed out the evidence that contradicts the notion that  consumption of saturated fat and cholesterol is a problem. Instead, there is growing evidence that easily oxidized polyunsaturated fat (vegetable oil) contributes to atherosclerosis , cardiovascular disease and chronic inflammation. Likewise, there is growing evidence that consumption of sweetened foods and beverages, as well as refined flour foods (which increase blood sugars much more than whole foods) are wreaking havoc in many ways.

So if there is a link between dietary sugar/refined carbohydrate consumption, blood sugar levels and disease, mediated by inflammation and glycosylation, what can we do about it? If there is a link between excessive consumption of pro-inflammatory and easily oxidized refined vegetable oils (linoleic acid) what can we do about it?

  • Avoid sweetened food and beverages
  • Drink only water and modest amounts of coffee or tea.
  • Avoid flour foods and other forms of refined carbohydrate which result in blood sugar surges and over time stress the pancreas
  • Eat only whole foods
  • Save your carbs for dinner
  • Walk for 15 minutes after every meal or 30-45 minutes per day
  • Engage in resistance training (weight lifting, resistance bands) for 20-30 minutes twice per week.
  • Get 8-9 hours of sleep each night
  • And if you really want to get serious about nutritional changes,  eat only the foods we have evolved to eat. Eat like a hunter-gatherer. Eat only pastured meat, free range poultry and free range eggs, fresh  wild fish and seafood, fresh  vegetables, fresh fruits and nuts.  Avoid grains, legumes, dairy. Avoid refined vegetable oils. Do not eat any food with “partially hydrogenated oil” or “hydrogenated oil” of any kind.

Resistance training twice per week for just 20-30 minutes will increase muscle mass and insulin sensitivity, lower blood sugars, preserve bone density, and provide many health benefits.

Eating most  carbs at dinner improved weight loss, lowered hunger, reduced abdominal circumference and enhanced body fat mass reductions in a calorie restricted weight loss study of obese adults.

Greater weight loss and hormonal cha… [Obesity (Silver Spring). 2011] – PubMed – NCBI

Sleep deprivation impairs insulin sensitivity, increases the risk of diabetes, hypertension, cardiovascular disease, depression, accidents and cancer, impairs immune function and wound healing, and impairs weight loss on a calorie restricted diet.

Meta-Analysis of Short Sleep Duration and Obesity in Children and Adults

Sleep duration and body mass index in twins: a gene-en… [Sleep. 2012] – PubMed – NCBI

Impact of insufficient sleep on total daily energy expenditure, food intake, and weight gain.

Neurobiological consequences of sleep deprivation.

Sleep and type 2 diabetes mellitus- clinical implications.

The influence of shift work on cognitive functions and oxidative stress.

Sleep disorders and depression: brief review of the literature, case report, and nonpharmacologic interventions for depression.

The impact of sleep deprivation on food desire in the human brain.

Walking 15 minutes after every meal in adults 60 years and older significantly improved 24 hour blood glucose control relative to control subjects who did not walk and was significantly more effective than 45 minutes of sustained morning or afternoon walking in lowering 3 hour post-dinner glucose levels.

Three 15-min bouts of moderate postmeal walking significantly improves 24-h glycemic control in older people at risk for impaired glucose tolerance.

Food, sleep, exercise and stress are the primary determinants of health.

While this post discussed two of three proposed mechanisms linking blood sugar levels to disease (modified LDL and AGEs) I did not discuss inflammation. The relationship between dietary sugar, refined carbohydrates and inflammation will be discussed in future posts.

In the meantime, stay tuned for “an egg a day keeps the doctor away”.

Peace,

Bob Hansen MD

Polyunsaturated fat, Saturated fat and the AHA

The present paradigm among physicians and cardiologists presents saturated fat as a disease producing component of animal foods. Dietary recommendations include the reduction of saturated fat and replacement with carbohydrates and/or monounsaturated and polyunsaturated fats. In fact, the American Heart Association (AHA) updated its recommendations to increase the consumption of polyunsaturated fats as a percentage of total caloric intake in January 2009.

This was met by protests from three NIH scientists who had done extensive research in the area of fat consumption and health. Those scientists wrote letters to the editor of Circulation, the scientific journal of the AHA. Those protest letters were not published in print but were published on-line (where only geeks like me would find them,  the vast majority of physicians would never lay eyes on them)

The authors of those letters subsequently produced a brilliant study that involved forensic research. They conducted interviews with principal investigators who directed the studies upon which the AHA had based it’s recommendations. They discovered important data that had been collected but not mentioned in those study publications by painstakingly sleuthing multiple sources. They then produced a meta-analysis of the data from the studies. Their meta-analysis was published in the British Journal of Nutrition Dec 2010.

http://www.ncbi.nlm.nih.gov/pubmed/21118617

What they found was astonishing. The AHA had based it’s recommendations on faulty data. A major point of refutation involved  omega 3 fatty acids (fish oil which is arguably cardio- protective) vs omega 6 fatty acids. Both are poly-unsaturated fatty acids (PUFA). The AHA paradigm has been that replacing saturated fat with omega 6 PUFA results in reduction of cholesterol (short term studies) and therefore should reduce heart attacks and stroke. But the studies they used to support their recommendations were not “clean”.

Only three of the nine studies were “pure” omega 6 interventions, which increased omega-6 FA without a concurrent rise in omega-3.

Four of the studies increased both omega 3 and omega 6 PUFA. In one of those four studies the patients were given the equivalent of 16 fish oil capsules per day.

The control diets had an estimated 3% manufactured trans fats in the diet. This unquestionably increases risk of heart attack and creates a confounding factor.

The Omega 6 diets increased the risk of heart disease and death compared to the mixed omega 3 and omega 6 studies. The risk of cardiac death was increased by 28% in the omega 6 diets compared to the mixed diets.

The mixed omega 6 omega 3 diets showed an 8% risk reduction of death from all causes and a 22% risk reduction from cardiac death.

So the AHA had made recommendations that could possibly be harmful and certainly not helpful. Despite this great piece of investigative science, the AHA did not change it’s recommendations.

Since that time Christopher Ramsden and colleagues have published a sequel “to evaluate the effectiveness of replacing dietary saturated fat with omega 6 linoleic acid, for the secondary prevention of coronary heart disease and death”.

http://www.ncbi.nlm.nih.gov/pubmed/23386268

In their summary they stated:

“substituting dietary linoleic acid in place of saturated fats increased the rates of death from all causes, coronary heart disease, and cardiovascular disease. “

There you have it. The AHA has not withdrawn it’s dietary recommendations to increase n-6 fat despite the compelling evidence to the contrary. This is unfortunately a consistent pattern.

Why would an increase in omega 6 fats and a reduction in saturated fat increase cardiovascular events?

Here is one explanation which is supported by basic science. Omega 6 fats are PUFA (polyunsaturated). PUFA are easily oxidized but saturated fat is not. When PUFA sit in the membrane (outer wall) of LDL particles they become oxidized and the oxidized LDL particle stimulates macrophages (white blood cells) to become foam cells and create plaque in the walls of your arteries. Saturated fats are not easily oxidized. Saturated fats do not contribute to the formation of oxidized LDL.

The AHA encourages us to consume “vegetable oils” (oils made from corn, soy, cottonseed, safflower, etc) instead of saturated fat. The predominant fat in “vegetable oil” is linoleic acid, the major omega 6 fat in the American diet. Linoleic acid is not the hero in this story and saturated fat is not the villain that the AHA portrays it to be.

Having said that, one might ask the following. If PUFA are easily oxidized and omega 3 fats are are also PUFA, then how could omega 3 fats be “cardio-protective” while omega 6 fats are damaging?

Good question. That will be addressed in  future posts.

But before we get to that, there are other data on saturated fats that must be discussed in order to dispel the fear of saturated fat.  That data and discusion will come in the next post.

Go in peace, the post is ended.

Bob Hansen MD