Yesterday I posted a comment on Medscape after reading an article Longtime Dietary Fat Advice Unsupported by Data: Analysis . Medscape is a website with articles and news written for physicians and other health professionals. Anyone can access this information by creating a user name and password, there is no fee.
Here is my comment. It is long and technical. I will provide an explanation in lay terms after quoting myself.
Sugar, especially HFCS (high fructose corn syrup), used in so many foods is more inflammatory than saturated fat. Grass fed meat from ruminants has a fatty acid mix that is exactly the same as wild game, which we evolved to eat, along with tubers, green leafy vegetables, and fruit in season. Excess refined fructose intake AND use of modern refined “vegetable oils” along with non-healthy grains combine to cause excess caloric intake, NAFLD (non-alcoholic fatty liver disease), obesity, metabolic syndrome and CAD (coronary artery disease). N6 PUFA (omega six polyunsaturated fatty acids) are easily oxidized. N3 PUFA (omega 3 fatty acids) despite greater number of double bonds are protected from oxidation in cell and Lipoprotein membranes by plasmalogens as opposed to linoleic acid which is not easily incorporated into plasmalogens. The PUFA in vegetable oils (linoleic acid) is the FA (fatty acid) that is oxidized on LDL particles and remnant particles, stimulating monocytes to transform to macrophages and then foam cells. The USDA, ADA and AHA have had it upside down for decades and they still fail to admit folly. We evolved for > 1 million years without grains and they have contributed to disease. Per calorie fresh vegetables have five times the amount of fiber compared to whole grains. We do not need grains and would be better without them. They contain anti-nutrients and wheat, hybridized in the 1980s to a storm resistant dwarf plant, now has 50 times more gluten/gliadin than the old wheat. This has generated more gluten intolerance and celiac. Our greatest nutritional threats to public health include refined sugar, carbohydrates predominantly from grains and refined vegetable oils. Vegetable oils are not healthy, we did not evolve to eat them. N3 FAs are anti-inflammatory but have been competing in our diets with a sea of inflammatory N6 PUFA from unnatural refined and easily oxidized “vegetable oils”. Even though PUFA can reduce LDL-C they wreak havoc by creating ox-LDL particles which initiate the cascade of atherosclerosis. Substituting SFA (saturated fatty acids) with PUFA results in increased levels of Lp(a) and oxLDL in humans, not a good thing. Close the feed lots, stop government subsidy of corn, wheat, dairy and soy, eat meat from grass fed ruminants, wild seafood, fresh organic vegetables and fruits in season. Nibble on tree nuts. Stop creating carcinogens with high dry heat cooking methods and we will watch obesity, insulin resistance, metabolic syndrome and atherosclerosis melt away.
That was my comment. Here is some explanation.
I have previously discussed the pro-inflammatory nature of refined “vegetable oils”. “Vegetable oils” are actually not from vegetables, they are from grains, seeds and legumes. The two major sources of excess omega six polyunsaturated fats in the American diet are corn oil and soy oil marketed by various brand names such as Wesson. They are major components of margarine and other butter substitutes and are present in most salad dressings. Most salad dressings sold in our supermarkets contain high levels of easily oxidized unhealthy refined “vegetable oils” and HFCS. The use of these salad dressings converts a healthy salad into a vector for disease.
The major source of caloric sweeteners in our food and beverages is high fructose corn syrup. Both corn (oil and sugar) and soy predominate our processed food supply because they are cheap. They are cheap because our tax dollars subsidize their production. This subsidy started during the Nixon administration. Once a food subsidy is put in place it is very difficult to eliminate, Big Agriculture provides a deep pocket for lobby money and our elected officials from the mid-west bread-basket respond to $$.
Another major source of disease causing elements in the standard American diet is highly refined flour from wheat. Doctors Davis and Perlmutter discuss the problems associated with wheat-flour foods in their books Wheat Belly and Grain Brain respectively. The production of wheat has also been subsidized since the Nixon administration.
Wheat is not what it used to be. A new dwarf hybrid wheat has predominated the US market since the 1980s. Bread and pasta are not what they used to be when great grand-mother made her own bread and pasta in the kitchen from coarsely ground whole flour. But even if we all went back to making our own whole-grain bread and pasta from locally ground pre-1980s wheat, bread, pasta and pastry would still present a health risk because of issues related to intestinal permeability, auto-immune disease (now epidemic in the USA), and the presence of nasty lectins and phytates (discussed in my manifesto and previous posts).
The Medscape comment quoted above describes adverse consequences caused by replacing saturated fat in the diet with “vegetable oils”. This is a complex subject and I will try to be brief for now but promise to expand on this in a future post.
Many factors contribute to atherosclerosis, heart attack and stroke. Sedentary lifestyle, stress, inadequate restorative sleep, smoking and poor dietary choices top the list. These factors also contribute to obesity, diabetes, metabolic syndrome, insulin resistance and many cancers.
DIETARY FACTORS:
The combination of sugared foods and beverages (predominantly sweetened with HFCS), refined flour foods, and excess consumption of the PUFA in “vegetable oils” TOGETHER contribute to the formation of plaque in the walls of our arteries (atherosclerosis).
How does this happen?
LDL (low density lipoprotein) is a particle that transports cholesterol and triglycerides through our blood to our organs. This particle is comprised of a core and a surrounding membrane. Here is a picture.

The core contains cholesterol in a storage form (esters) and triglycerides. The outer membrane includes a large protein called apoprotein B-100, “free” cholesterol molecules and phospholipids. The phospholipids contain fatty acids, including PUFA.
LDL has been demonized as “the bad cholesterol” and that demonization has mislead the public.
LDL is the major lipoprotein in our blood but there are others that have different names.
Cholesterol is cholesterol, whether it is carried in LDL or HDL. When carried in the core of a lipoprotein it is carried as a cholesterol ester. 80% of the cholesterol in an LDL particle is carried as an ester in the core. 20% is carried as “free” cholesterol on the outer surface or membrane.

HDL (high density lipoprotein) is smaller and denser. HDL has been called “the good cholesterol”, another misnomer.
HDL particles, when they are functioning correctly can protect us from atherosclerosis but in patients with diabetes, obesity, and insulin resistance, HDL particles do not function well and in fact probably contribute to disease. (More about that in a future post)
But back to LDL.
Although the risk of cardiovascular disease is correlated with the amount of cholesterol carried by LDL in our blood (referred to as LDL-C), the total amount of cholesterol shuttled by LDL particles is much less relevant than one would be led to believe given the great use of statin drugs to lower LDL-C.
The short version is as follows.
Compared to LDL-C, a much better predictor of cardiovascular disease is the amount of “modified” LDL particles circulating in the blood. Oxidized LDL particles are one form of “modified LDL”. LDL can also be modified by excess blood sugar levels (especially from HFCS). This modification is referred to as glycosylated or glycated LDL. In this latter form of modification, the major protein on the outer membrane of the LDL particle (apo B 100 in the picture above) becomes attached to a sugar and the result is an LDL particle that is not easily cleared by normal processes. The modified LDL is not “recognized” by the LDL receptors that act as entry points into our cells for proper processing. The result is that the glycated LDL particles circulate longer and are more likely to use up their anti-oxidants (Vitamin E and Co-enzyme Q 10).
As a result glycated LDL are more likely to become oxidized. That is not good because oxidized LDL sets up a cascade of unhealthy events.
The portion of the LDL particle that becomes oxidized is the fat (fatty acid) from “vegetable oil”, specifically the fatty acid called linoleic acid. This fatty acid has two double bonds making it more likely to be oxidized than for example oleic acid, the major fatty acid in extra virgin olive oil which has only one double bond.
The double bonds between the carbons in the fatty acids are unstable and easily oxidized. The single bonds in saturated fat do not get oxidized.
All other things being equal (and you will see that they are not), the more double bonds in a fatty acid the greater chance for oxidation.
Here is a picture showing the linoleic acid, also called linoleate, on the outer membrane of the LDL particle.

And here is a picture that shows the phospholipids that contain the linoleic acid.

Let’s say it again. The fatty acid found in “vegetable” oil, linoleic acid, is easily oxidized because it has two double bonds.
Saturated fats are not oxidized because they contain no double bonds.
The part of the LDL particle that becomes oxidized is the fatty acid that comes from “vegetable oils”.
A particular kind of immune cell (white blood cells called monocytes) have special receptors for oxidized LDL particles. When ox-LDL are “seen” by these monocytes, the monocytes become transformed into macrophages. Macrophages are designed to destroy bacteria that invade our bodies. The oxidized LDL particles resemble the structures of invading bacteria. The macrophages, with very specialized receptors for oxidized LDL, “swallow” the LDL particles and release toxic chemicals to destroy “the invader”. The macrophages then become “foam cells” in the walls of our arteries, initiating the creation of plaque. Here is a picture.
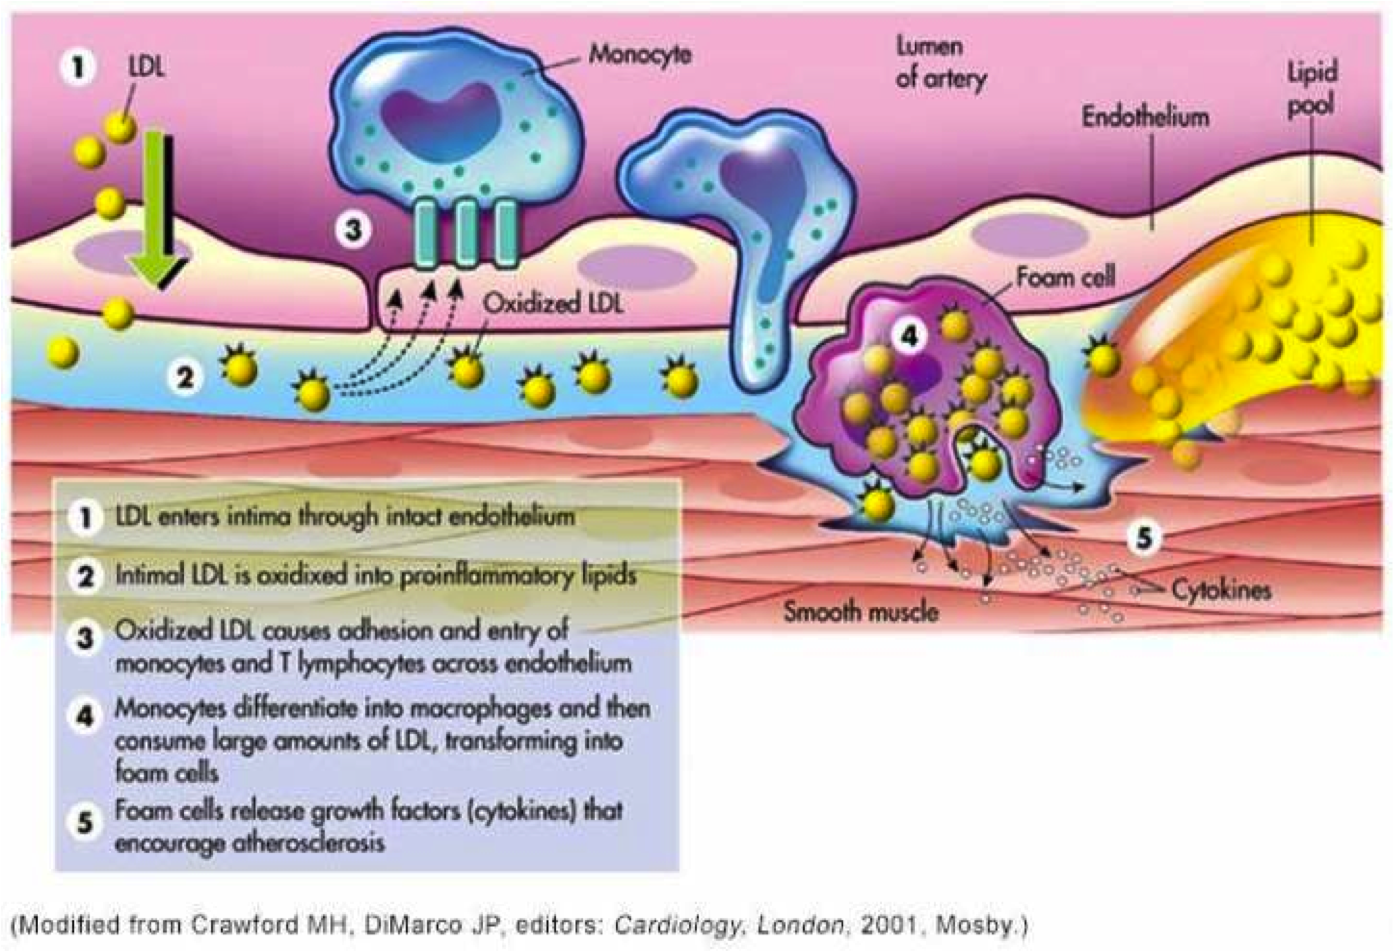
This picture depicts the oxidation occurring in the wall of the artery after LDL particles have penetrated the wall. However LDL particles can and do become oxidized while still circulating in the blood and these oxidized particles can stimulate monocytes to transform into macrophages and gobble up the oxidized or modified LDL while these particles are still circulating in the blood.
How and whether unmodified LDL particles cross the wall of arteries into the “sub-endothelial” area remains an unsolved complex issue. The picture above implies that LDL particles simply move across the endothelial cells that line the wall of the artery but that is a presumption.
Clearly, macrophages that have “swallowed” modified LDL particles have mechanisms to work their way between the junctions formed by adjacent endothelial cells.
This is an important distinction because many cardiologists believe that what drives atherosclerosis is a mass effect. The greater the number of LDL particles, the more likely they are to cross the endothelial barrier, get oxidized and retained and start the process of plaque formation. However the process is much more complex and not clearly understood.
We do not yet know or understand completely the factors that influence the permeability of the endothelium to Lipoprotein particles. We do know that modified (oxidized and glycated LDL) disrupt the protective surface of endothelial cells which is called the glyocalyx. Other factors that disrupt the glyocalyx include high blood sugars, dramatic fluctuations in blood pressure (too high or too low), oxidative stress, infections, and circulating endotoxin (which is governed by intestinal permeability).
It is clear from several studies that modified (oxidized) LDL as a single variable predicts cardiovascular disease and heart attacks with much greater accuracy than LDL-C (total cholesterol content of LDL particles). It is also clear that monocyte receptors are specific for modified LDL and that the process that initiates the cascade of events that leads to plaque formation involves the interaction between modified lipoprotein particles and the immune system (monocytes).
Now here is another twist.
Omega 3 fatty acids in fish oil are considered “heart healthy”. They help prevent heart attacks and strokes. They also decrease inflammation throughout the body thereby producing many health benefits.
BUT OMEGA 3 FAT HAS MORE DOUBLE BONDS THAN OMEGA 6 FAT (LINOLEIC ACID) YET THEY HELP PROTECT THE HEART. HOW CAN THAT BE?
How do they avoid contributing to atherosclerosis? Are they not even more readily oxidized than linoleic acid?
The simple answer is no.
The major reason is that the omega three fatty acids are protected by “plasmalogens” which are important components of our LDL particle outer membranes. Plasmalogens are found in the membranes of lipoprotein particles and in the membranes of human cells. Because of their chemical structures, omega three fats are easily incorporated into plasmalogens which protect the double bonds of omega three fats from oxidation. Linoleic acid, the predominant component of “vegetable oils” is not easily incorporated into the protective arms of plasmalogens.
This selective protection is well described on pages 141-142 of “The Fats of Life”, written by Dr. Glen Lawrence and published in paperback in 2013. (link below)
I asked Dr. Lawrence about this issue in an email and here was his response.
“The omega-3 fatty acids are preferentially incorporated into plasmalogens, which act as antioxidants due to the double bond adjacent to the ether linkage of these phospholipids. This structure would tend to scavenge free radicals or reactive oxygen species near the surface of the membrane, rather than allowing them to penetrate deeper in the membrane where the double bonds of PUFA are located. This makes any polyunsaturated fatty acids attached to the plasmalogens more resistant to oxidation than they would be in a regular phospholipid. See pp 141-142 of The Fats of Life. The shorter chain and less unsaturated linoleic acid does not tend to be incorporated into plasmalogens.”
In summary:
- “Vegetable oil” is actually not oil from vegetables but rather a highly processed and refined oil. This oil contains primarily the easily oxidized omega 6 PUFA (polyunsaturated fatty acid) linoleic acid. Oxidation can occur during manufacture, before consumption while sitting in the bottle, but especially during high heat cooking (fried foods). Oxidation can also in your body as this fat circulates in your blood on the membrane of lipoprotein particles.
- LDL particles are the major lipoprotein particles that shuttle cholesterol and fatty acids (in in the form of triglycerides) through our bodies in our bloodstream.
- Modified LDL particles (glycated and/or oxidized LDL) stimulate monocytes (immune cells) to transform into macrophages and gobble up the modified LDL. In addition, glycated LDL particles are more easily oxidized because they circulate longer in our blood.
- Macrophages become filled with modified LDL. These are called foam cells. Foam cells initiate a cascade of events that lead to the formation of plaque in the walls of our arteries.
- The part of the LDL particle membrane that becomes oxidized is the phospholipid that contains linoleic acid which comes from “vegetable oils”
- High amounts of sugar, especially HFCS, and highly refined flour foods in our diets cause larger blood sugar fluctuations than whole foods and therefore contribute to the glycation of LDL particles. This glycation leads to more oxidation of LDL. In this manner HFCS and refined flour foods contribute to the process of atherosclerosis.
- High amounts of sugar, HFCS and refined flour foods also contribute to obesity, insulin resistance and diabetes which then increase the risk of heart attack and stroke.
- Several factors contribute to the disruption of the glycocalyx which is the protective surface of the endothelial cells that line our arteries. These include but are not limited to modified LDL, inflammation, high blood sugars, abnormal fluctuations in blood pressure, circulating endotoxin (associated with increased intestinal permeability), infections. Disruption of the glycocalyx contributes to the formation of plaque (atherosclerosis).
- Modified LDL particles might also migrate through the junctions that connect adjacent endothelial cells either inside macrophages or on their own. Many factors, known and unknown likely determine the susceptibility or permeability of these junctions to this migration.
These are the major points, but there is allot more to discuss. Substituting “vegetable oils” for saturated fat in our diets not only increases the amount of oxidized LDL but also increases a dangerous lipoprotein called Lp(a). On third of Americans have an amount of Lp(a) that is considered “high risk” for heart attack and stroke. More about that in a future post.
Then there is the process of an actual heart attack or stroke which involves disruption of plaque and the creation of a blood clot that ultimately disrupts the flow of blood and the death of heart or brain tissue. The susceptibility of plaque to disruption is a huge topic that involves high blood pressure, diabetes, insulin resistance, oxidative stress, inadequate sleep, and stress to name a few. So much more to discuss.
But getting back to the title of this post, why don’t you ask your elected representatives why our tax dollars continue to subsidize nutritional root causes of death, disability and disease?
Here are some links to papers and books that support the discussion above.
Circulating Oxidized LDL Is a Useful Marker for Identifying Patients With Coronary Artery Disease
Erythrocyte fatty acid profiles can predict acute non-fatal myocard… – PubMed – NCBI
Low-density lipoprotein subclass patterns and risk of myocardial in… – PubMed – NCBI
Subendothelial Lipoprotein Retention as the Initiating Process in Atherosclerosis
Oxidative susceptibility of low density lipoprotein subfractions is… – PubMed – NCBI
Effects of linoleate-enriched and oleate-enriched diets in combinat… – PubMed – NCBI
Enhanced oxidative susceptibility and reduced antioxidant content o… – PubMed – NCBI
Susceptibility of small, dense, low-density lipoproteins to oxidati… – PubMed – NCBI
Modulation of Endothelial Glycocalyx Structure under Inflammatory Conditions
Oxidized Lipoproteins Degrade the Endothelial Surface Layer
S1P Control of Endothelial Integrity
Mechanical control of the endothelial barrier. – PubMed – NCBI
Therole of actin-binding proteins in the control of endothelial bar… – PubMed – NCBI
The Fats of Life, Dr. Glen Lawrence
Functions of plasmalogen lipids in health and disease
Finally a quote from the Dali Lama (thanks to my cousin Diane for bringing this to my attention).
“Man. Because he sacrifices his health in order to make money. Then he sacrifices money to recuperate his health. And then he is so anxious about the future that he does not enjoy the present, the result being that he does not live in the present or the future, he lives as if he is never going to die, and dies having never really lived.”
Eat clean, live clean, sleep well, exercise wisely, rest often, enjoy the company of loved ones, spend time outdoors and live in the present.
BOB